
Page 53 - Pipeline Risk Management Manual Ideas, Techniques, and Resources
P. 53
2/32 Risk Assessment Process
Additional studies have yielded similar correlations with aspect of a model, while others might merely see it as an unnec-
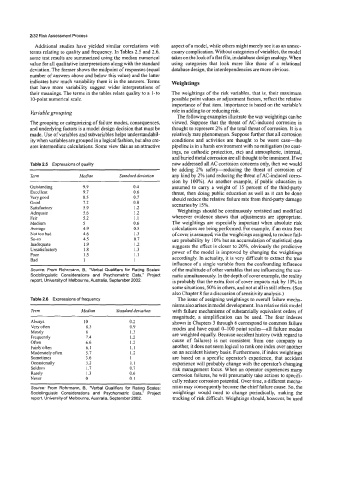
terms relating to quality and frequency. In Tables 2.5 and 2.6, essary complication. Without categories of variables, the model
some test results are summarized using the median numerical takes on the look of a flat file, in database design analogy. When
value for all qualitative interpretations along with the standard using categories that look more like those of a relational
deviation. The former shows the midpoint of responses (equal database design, the interdependencies are more obvious.
number of answers above and below this value) and the latter
indicates how much variability there is in the answers. Terms Weightings
that have more variability suggest wider interpretations of
their meanings. The terms in the tables relate quality to a 1-to The weightings of the risk variables, that is, their maximum
10-point numerical scale. possible point values or adjustment factors, reflect the relative
importance of that item. Importance is based on the variable’s
Variable grouping role in adding to or reducing risk.
The following examples illustrate the way weightings can be
The grouping or categorizing of failure modes, consequences, viewed. Suppose that the threat of AC-induced corrosion is
and underlying factors is a model design decision that must be thought to represent 2% of the total threat of corrosion. It is a
made. Use of variables and subvariables helps understandabil- relatively rare phenomenon. Suppose further that all corrosion
ity when variables are grouped in a logical fashion, but also cre- conditions and activities are thought to be worst case-the
ates intermediate calculations. Some view this as an attractive pipeline is in a harsh environment with no mitigation (no coat-
ings, no cathodic protection, etc) and atmospheric, internal,
and buried metal corrosion are all thought to be imminent. Ifwe
Table 2.5 Expressions of quality now addressed all AC corrosion concerns only, then we would
be adding 2% safety-reducing the threat of corrosion of
Term Median Standard deviation any kind by 2% (and reducing the threat of AC-induced corro-
sion by 100%). As another example, if public education is
Outstanding 9.9 0.4 assumed to carry a weight of 15 percent of the third-party
Excellent 9.7 0.6 threat, then doing public education as well as it can be done
Very good 8.5 0.7 should reduce the relative failure rate from third-party damage
Good 7.2 0.8
Satisfactory 5.9 1.2 scenariosby 15%.
Adequate 5.6 1.2 Weightings should be continuously revisited and modified
Fair 5.2 1.1 whenever evidence shows that adjustments are appropriate.
Medium 5 0.6 The weightings are especially important when absolute risk
Average 4.9 0.5 calculations are being performed. For example, if an extra foot
Not too bad 4.6 1.3 of cover is assumed, via the weightings assigned, to reduce fail-
so-so 4.5 0.7 ure probability by 10% but an accumulation of statistical data
Inadequate 1.9 1.2 suggests the effect is closer to 20%, obviously the predictive
Unsatisfactoi ry 1.8 I .3 power of the model is improved by changing the weightings
Poor 1.5 1.1
Bad 1 1 accordingly. In actuality, it is very difficult to extract the true
influence of a single variable from the confounding influence
Source: From Rohrmann. B.. “Verbal Qualifiers for Rating Scales: of the multitude of other variables that are influencing the sce-
Sociolinguistic Considerations and Psychometric Data,” Project nario simultaneously. In the depth of cover example, the reality
report, University of Melbourne, Australia, September 2002. is probably that the extra foot of cover impacts risk by 10% in
some situations, 50% in others, and not at all in still others. (See
also Chapter 8 for a discussion of sensitivity analysis.)
Table 2.6 Expressions of frequency The issue of assigning weightings to overall failure mecha-
nisms also arises in model development. In a relative risk model
Term Median Standard deviation with failure mechanisms of substantially equivalent orders of
magnitude, a simplification can be used. The four indexes
Always 10 0.2 shown in Chapters 3 through 6 correspond to common failure
Very often 8.3 0.9 modes and have equal @lo0 point scales-all failure modes
Mostly 8 1.3
Frequently 7.4 1.2 are weighted equally. Because accident history (with regard to
Often 6.6 1.2 cause of failures) is not consistent from one company to
Fairly often 6.1 1.1 another, it does not seem logical to rank one index over another
Moderately often 5.7 1.2 on an accident history basis. Furthermore, if index weightings
Sometimes 3.6 1 are based on a specific operator’s experience, that accident
Occasionally 3.2 1.1 experience will probably change with the operator’s changing
Seldom 1.7 0.7 risk management focus. When an operator experiences many
Rarely 1.3 0.6 corrosion failures, he will presumably take actions to specifi-
Never 0 0.1
cally reduce corrosion potential. Over time, a different mecha-
Source: From Rohrmann, B., “Verbal Qualifiers for Rating Scales: nism may consequently become the chief failure cause. So, the
Sociolinguistic Considerations and Psychometric Data,” Project weightings would need to change periodically, making the
report, University of Melbourne, Australia, September 2002. tracking of risk difficult. Weightings should, however, be used