
Page 48 - Pipeline Risk Management Manual Ideas, Techniques, and Resources
P. 48
Risk assessment models 2/27
conditions) and the line has had sections replaced with new sections have been installed to replace unacceptable older
pipe during the last few years. sections.
Next. the evaluator should insert break points for the sections
based on the top items on the prioritized list of condition Following these rules, the evaluator finds that his top listed
changes. This produces a trial sectioning of the pipeline. If the condition causes 15 sections to be created. By applying the sec-
number of sections resulting from this process is deemed to be ond condition rule, he has created an additional 8 sections.
too large, the evaluator needs to merely reduce the list (elimi- bringing the total to 23 sections. The third rule yields an addi-
nating conditions from the bottom of the prioritized list) until tional 14 sections, and the fourth causes an additional 6 sec-
an appropriate number of sections are obtained. This trial-and- tions. This brings the total to 43 sections in the 60-mile pipeline.
error process is repeated until a cost-effective sectioning has The evaluator can now decide if this is an appropriate num-
been completed. ber of sections. As previously noted, factors such as the desired
accuracy of the evaluation and the cost of data gathering and
E.xaniple 2.1: Sectioning the Pipeline analysis should be considered. If he decides that 43 sections is
too many for the company’s needs, he can reduce the number of
Following this philosophy, suppose that the evaluator of this sections by first eliminating the additional sectioning caused by
hypothetical Louisiana pipeline decides to section the line application of his fourth rule. Elimination of these 6 sections
according to the following rules he has developed: caused by age differences in the pipe is appropriate because it
had already been established that this was a lower-priority item.
Insert a section break each time the population density along That is, it is thought that the age differences in the pipe are not
a 1-mile section changes by more than 10%. These popula- as significant a factor as the other conditions on the list.
tion section breaks will not occur more often than each mile, If the section count (now down to 37) is still too high, the
and as long as the population density remains constant, a evaluator can eliminate or reduce sectioning caused by his third
section break is unwarranted. rule. Perhaps combining the corrosion engineer’s “good’ and
Insert a section break each time the soil corrosivity changes “fair” coating ratings would reduce the number of sections
by 30%. In this example, data are available showing the from I4 to 8.
average soil corrosivity for each 500-ft section of line.
Therefore, section breaks may occur a maximum of IO In the preceding example, the evaluator has roughed out a
times (5280 ft per mile divided by 500-ft sections) for each plan to break down the pipeline into an appropriate number of
mile ofpipeline. sections. Again, this is an inefficient way to section a pipeline
Insert a section break each time the coating condition and leads to further inefficiencies in risk assessment. This
changes significantly. This will be measured by the corro- example is provided only for illustration purposes.
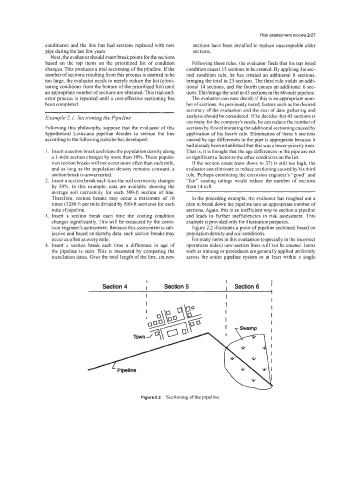
sion engineer’s assessment. Because this assessment is sub- Figure 2.2 illustrates a piece of pipeline sectioned based on
jective and based on sketchy data, such section breaks may population density and soil conditions.
occur as often as every mile. For many items in this evaluation (especially in the incorrect
Insert a section break each time a difference in age of operations index) new section lines will not be created. Items
the pipeline is seen. This is measured by comparing the such as training or procedures are generally applied uniformly
installation dates. Over the total length of the line, six new across the entire pipeline system or at least within a single
I I I
Section 4 I Section 5 I Section 6
I I
Town
Pipeline \ w‘
Figure 2.2 Sectioning of the pipeline.