
Page 68 - Pipeline Risk Management Manual Ideas, Techniques, and Resources
P. 68
Assessing third-party damage potential 3/47
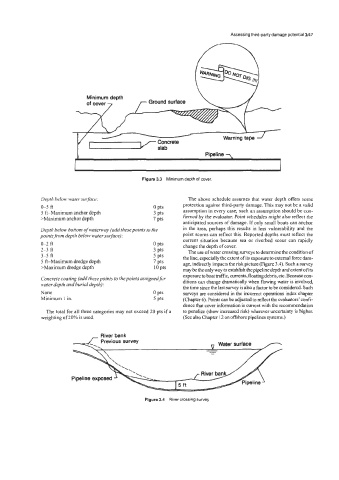
Minimum depth
of cover ,- Ground surface
1
Warning tape J
Pipeline -,
Figure 3.3 Minimum depth of cover
Depth below) water surJace: The above schedule assumes that water depth offers some
0-5 ft 0 pts protection against third-party damage. This may not be a valid
5 +Maximum anchor depth 3 pts assumption in every case; such an assumption should be con-
>Maximum anchor depth 7 pts firmed by the evaluator. Point schedules might also reflect the
anticipated sources of damage. If only small boats can anchor
Depth below bottom of waterway (add thesepoints to the in the area, perhaps this results in less vulnerability and the
points.from depth below water surface): point scores can reflect this. Reported depths must reflect the
current situation because sea or riverbed scour can rapidly
&2 ft 0 pts change the depth of cover.
2-3 ft 3 pts The use of water crossing surveys to determine the condition of
3-5 ft 5 pts the line, especially the extent of its exposure to external force dam-
5 %Maximum dredge depth 1 pts age, indirectly impacts the risk picture (Figure 3.4). Such a survey
>Maximum dredge depth 10 pts may be the only way to establish the pipeline depth and extent of its
exposure to boat trafic, currents, floating debris, etc. Because con-
Concrete coating (add these points to the points assigned fcr ditions can change dramatically when flowing water is involved,
uuter depth and burial depth):
the time since the last survey is also a factor to be considered. Such
None 0 pts surveys are considered in the incorrect operations index chapter
Minimum I in. 5 pts (Chapter 6). Points can be adjusted to reflect the evaluators’confi-
dence that cover information is current with the recommendation
The total for all three categories may not exceed 20 pts if a to penalize (show increased risk) wherever uncertainty is higher.
weighting of 20% is used. (See also Chapter 12 on offshore pipelines systems.)
River bank
Previous survey
Figure 3.4 River crossing survey