
Page 86 - Pipeline Risk Management Manual Ideas, Techniques, and Resources
P. 86
4/64 Corrosion Index
of a pipe wall is often expensive and damaging (excavation and ety of environments. Until the relationship between corrosion
coating removal are often necessary to directly inspect the pipe index and corrosion rate can be established, a theoretical rela-
material). Corrosion assessments therefore usually infer corro- tionship could be theorized. An example of this is shown in
sion potential by examining a few variables for evidence of cor- Chapter 14.
rosion. These inference assessments are then occasionally
confirmed by direct inspection. Information degradation
Characteristics that may indicate a high corrosion potential
are often difficult to quanti@. For example, in buried metal cor- As discussed in earlier chapters information has a usehl life
rosion, soil acts as the electrolyte-the environment that sup- span. Because corrosion is a time-dependent phenomenon and
ports the electrochemical action necessary to cause this type of corrosion detection is highly dependent on indirect survey
corrosion. Electrolyte characteristics are of critical importance, information, the timing of those surveys plays a role in uncer-
but include highly variable items such as moisture content, aer- tainty and hence risk.
ation, bacteria content, and ion concentrations. All of these The date ofthe information should therefore play a large role
characteristics are location specific and time dependent, which in any determination based on inspections or surveys. One way
makes them difficult to even estimate accurately. The parame- to account for inspection age is to make a graduated scale indi-
ters affecting atmospheric and internal corrosion potentials can cating the decreasing usefulness of inspection data over time.
be similarly difficult to estimate. This measure of information degradation can be applied to the
Because corrosion is often a highly localized phenomenon, scores as a percentage. After a predetermined time period,
and because indirect inspection provides only general informa- scores based on previous inspections degrade-conservatively
tion, uncertainty is usually high. With this difficulty in mind, assuming increasing risk-to some predetermined value. An
the corrosion index reflects the potential for corrosion to occur, example is shown in Table 2.2. In that example, the evaluator
which may or not mean that corrosion is actually taking place. has determined that a previous inspection yields no useful
The index, therefore, does not directly measure the potential for information after 5 years and that the usefulness degrades
failure from corrosion. That would require inclusion of addi- uniformly at 20% per year.
tional variables such as pipe wall thickness and stress levels.
So, the primary focus of this assessment is the potential for
active corrosion. This is a subtle difference from the likelihood Changes from previous editions
of failure by corrosion. The time to failure is related to the
resistance of the material, the aggressiveness of the failure After several years of use of previous versions of the corrosion
mechanism, and the time of exposure. The material resistance algorithm, some changes have been proposed in this edition of
is in turn a function of material strength and dimensions, most this book. These changes reflect the input of pipeline operators
notably pipe wall thickness, and the stress level. and corrosion experts and are thought to enhance the model’s
In most cases, we are more interested in identifying locations ability to represent corrosion potential.
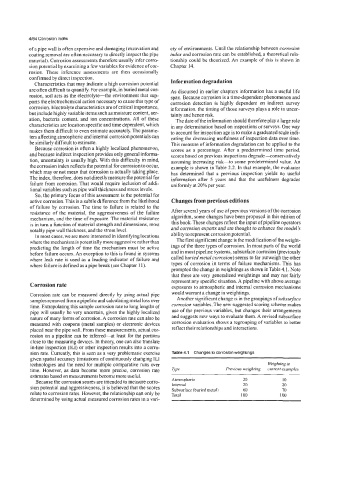
where the mechanism is potentially more aggressive rather than The first significant change is the modification ofthe weight-
predicting the length of time the mechanism must be active ings of the three types of corrosion. In most parts of the world
before failure occurs. An exception to this is found in systems and in most pipeline systems, subsurface corrosion (previously
where leak rate is used as a leading indicator of failure and called buried metal corrosion) seems to far outweigh the other
where failure is defined as a pipe break (see Chapter 1 1). types of corrosion in terms of failure mechanisms. This has
prompted the change in weightings as shown inTable 4.1. Note
that these are very generalized weightings and may not fairly
represent any specific situation. A pipeline with above average
Corrosion rate exposures to atmospheric and internal corrosion mechanisms
Corrosion rate can be measured directly by using actual pipe would warrant a change in weightings.
samples removed from a pipeline and calculating metal loss over Another significant change is in the groupings of subsurface
time. Extrapolating this sample corrosion rate to long lengths of corrosion variables. The new suggested scoring scheme makes
pipe will usually be very uncertain, given the highly localized use of the previous variables, but changes their arrangements
nature of many forms of corrosion. A corrosion rate can also be and suggests new ways to evaluate them. A revised subsurface
measured with coupons (metal samples) or electronic devices corrosion evaluation shows a regrouping of variables to better
placed near the pipe wall. From these measurements, actual cor- reflect their relationships and interactions.
rosion on a pipeline can be inferred-at least for the portions
close to the measuring devices. In theory, one can also translate
in-line inspection (ILI) or other inspection results into a corro-
sion rate. Currently, this is seen as a very problematic exercise Table 4.1 Changes to corrosion weightings
given spatial accuracy limitations of continuously changing ILI ~~ ~ ~
technologies and the need for multiple comparative runs over Werghtrng m
time. However, as data become more precise, corrosion rate Previous naightrng current examples
estimates based on measurements become more useful.
10
Because the corrosion scores are intended to measure corro- Atmospheric 20 20
Internal
20
sion potential and aggressiveness, it is believed that the scores Subsurface (buried metal) 60 70
relate to corrosion rates. However, the relationship can only be Total 100 100
determined by using actual measured corrosion rates in a vari-