Page 236 - Pipeline Rules of Thumb Handbook
P. 236

Corrosion/Coatings  223


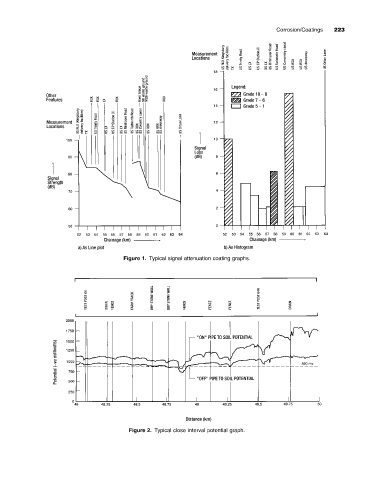
                                          Figure 1. Typical signal attenuation coating graphs.


                                            Figure 2. Typical close interval potential graph.
   231   232   233   234   235   236   237   238   239   240   241