
Page 269 - Pipeline Rules of Thumb Handbook
P. 269
256 Pipeline Rules of Thumb Handbook
Figure 5. Block diagram illustrates gas chromatograph oven.
Figure 4. Bypass loop reduces sampling lag time.
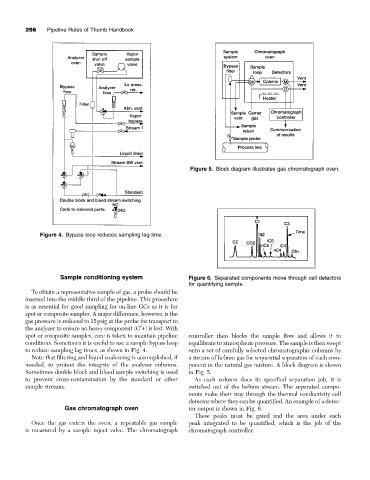
Sample conditioning system Figure 6. Separated components move through cell detectors
for quantifying sample.
To obtain a representative sample of gas, a probe should be
inserted into the middle third of the pipeline. This procedure
is as essential for good sampling for on-line GCs as it is for
spot or composite samples. A major difference, however, is the
gas pressure is reduced to 15psig at the probe for transport to
6
the analyzer to ensure no heavy component (C +) is lost. With
spot or composite samples, care is taken to maintain pipeline controller then blocks the sample flow and allows it to
conditions. Sometimes it is useful to use a sample bypass loop equilibrate to atmospheric pressure. The sample is then swept
to reduce sampling lag times, as shown in Fig. 4. onto a set of carefully selected chromatographic columns by
Note that filtering and liquid coalescing is accomplished, if a stream of helium gas for sequential separation of each com-
needed, to protect the integrity of the analyzer columns. ponent in the natural gas mixture. A block diagram is shown
Sometimes double block and bleed sample switching is used in Fig. 5.
to prevent cross-contamination by the standard or other As each column does its specified separation job, it is
sample streams. switched out of the helium stream. The separated compo-
nents make their way through the thermal conductivity cell
detector where they can be quantified. An example of a detec-
Gas chromatograph oven tor output is shown in Fig. 6.
These peaks must be gated and the area under each
Once the gas enters the oven, a repeatable gas sample peak integrated to be quantified, which is the job of the
is measured by a sample inject valve. The chromatograph chromatograph controller.