
Page 420 - Planning and Design of Airports
P. 420
364 Airp o r t D e sign
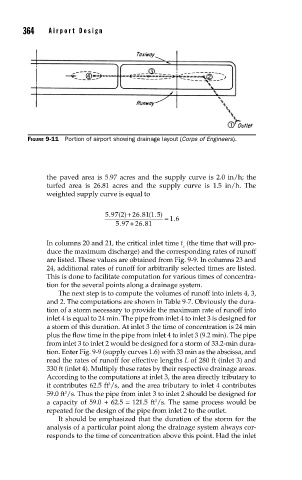
FIGURE 9-11 Portion of airport showing drainage layout (Corps of Engineers).
the paved area is 5.97 acres and the supply curve is 2.0 in/h; the
turfed area is 26.81 acres and the supply curve is 1.5 in/h. The
weighted supply curve is equal to
5 97 2 ( )+ 26 81 1 5 . ) =
(
.
.
+
.
597 2681 16 .
.
In columns 20 and 21, the critical inlet time t (the time that will pro-
c
duce the maximum discharge) and the corresponding rates of runoff
are listed. These values are obtained from Fig. 9-9. In columns 23 and
24, additional rates of runoff for arbitrarily selected times are listed.
This is done to facilitate computation for various times of concentra-
tion for the several points along a drainage system.
The next step is to compute the volumes of runoff into inlets 4, 3,
and 2. The computations are shown in Table 9-7. Obviously the dura-
tion of a storm necessary to provide the maximum rate of runoff into
inlet 4 is equal to 24 min. The pipe from inlet 4 to inlet 3 is designed for
a storm of this duration. At inlet 3 the time of concentration is 24 min
plus the flow time in the pipe from inlet 4 to inlet 3 (9.2 min). The pipe
from inlet 3 to inlet 2 would be designed for a storm of 33.2-min dura-
tion. Enter Fig. 9-9 (supply curves 1.6) with 33 min as the abscissa, and
read the rates of runoff for effective lengths L of 280 ft (inlet 3) and
330 ft (inlet 4). Multiply these rates by their respective drainage areas.
According to the computations at inlet 3, the area directly tributary to
it contributes 62.5 ft /s, and the area tributary to inlet 4 contributes
3
59.0 ft /s. Thus the pipe from inlet 3 to inlet 2 should be designed for
3
a capacity of 59.0 + 62.5 = 121.5 ft /s. The same process would be
3
repeated for the design of the pipe from inlet 2 to the outlet.
It should be emphasized that the duration of the storm for the
analysis of a particular point along the drainage system always cor-
responds to the time of concentration above this point. Had the inlet