
Page 422 - Planning and Design of Airports
P. 422
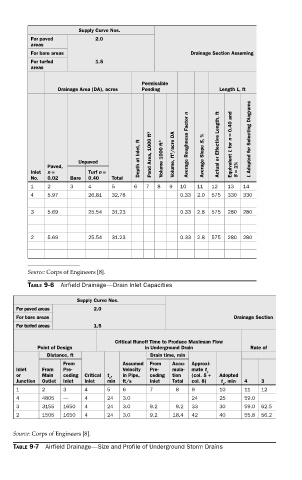
Supply Curve Nos.
             For paved        2.0
             areas
             For bare areas                              Drainage Section Assuming
             For turfed       1.5
             areas
                                              Permissible
                    Drainage Area (DA), acres       Ponding      Length L, ft

                                                                    = 0.40 and


                                          Depth at Inlet, ft  Pond Area, 1000 ft 2  Volume 1000 ft 3  Volume, ft 3 /acre DA  Average Roughness Factor n  Average Slope S, %  Actual or Effective Length, ft  L for n  L Adopted for Selecting Diagrams


                          Unpaved
                 Paved,                                             Equivalent  = 1%
             Inlet  n =     Turf n =
             No.  0.02  Bare  0.40  Total                            S
             1   2     3    4      5     6  7  8   9  10  11  12   13  14
             4   5.97       26.81  32.78              0.33  2.0  575  330  330
             3   5.69       25.54  31.23              0.33  2.8  575  280  280


             2   5.69       25.54  31.23              0.33  2.8  575  280  280


            Source: Corps of Engineers [8].
            TABLE 9-6  Airfield Drainage—Drain Inlet Capacities

                         Supply Curve Nos.
         For paved areas      2.0
         For bare areas                                             Drainage Section
         For turfed areas     1.5

                                    Critical Runoff Time to Produce Maximum Flow
              Point of Design               in Underground Drain         Rate of
                 Distance, ft                 Drain time, min
                      From            Assumed  From   Accu-  Approxi-
         Inlet  From   Pre-           Velocity   Pre-  mula-  mate t
                                                             c
         or     Main  ceding  Critical  t ,  in Pipe,   ceding  tion  (col. 5 +   Adopted
                                  c
         Junction  Outlet  Inlet  Inlet  min  ft/s  Inlet  Total  col. 8)  t , min ,  4  3
                                                                 c
         1      2     3    4      5   6      7      8    9      10     11   12
         4      4805  —    4      24  3.0                24     25     59.0
         3      3155  1650  4     24  3.0    9.2    9.2  33     30     59.0  62.5
         2      1505  1650  4     24  3.0    9.2    18.4  42    40     55.8  56.2
        Source: Corps of Engineers [8].

        TABLE 9-7  Airfield Drainage—Size and Profile of Underground Storm Drains