
Page 267 - Plant design and economics for chemical engineers
P. 267
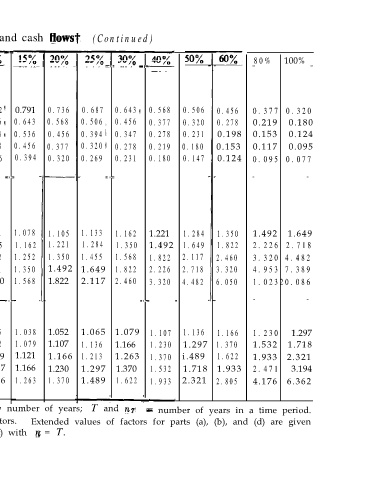
TABLE 3
 Discount and compounding factors for continuous interest and cash flows?  (Continued)
  --
 r as percent     -.   --                - 80%   100%  -
 (d) Decline to zero at a constant rate
 over a period of years starting with
 the reference point
 Pp!  1st 5 years  0.983  0.922  0.852  1  0.791  0.736  0.687  0.643  1 0.568  0.506  0.456  0.377 0.320
 1st 10 years  0.968  0.852  0.736 1 0.643  0.568  0.506 , 0.456  , 0.377  0.320  0.278  0.219  0.180
 0  1st 15 years  0.952  0.791  0.643 1 0.536  0.456  0.394 i  0.347  0.278  0.231  0.198  0.153  0.124
 I st 20 years  0.936  0.736  0.568 1 0.456  0.377  0.320 1  0.278  0.219  0.180  0.153  0.117  0.095
 $Tp -(l-e-rnr)/mrl=Fd   1st  25 years  0.922  0.687  0.506 , 0.394  0.320  0.269 I 0.231  0.180  0.147  0.124  0.095 0.077
                  -_
  --                                     -       -
 Compounding factors to give future worths for
 cash flows which
 (e)  Occur in an instant at a point in
 time before the reference point
 F.   W.  $4  year before  1.005  1.025  1.051  1.078  1.105  1.133  1.162  1.221  1.284  1.350  1.492  1.649
 1 year before  1.010  1.051  1.105  1.162  1.221  1.284  1.350  1.492  1.649  1.822  2.226 2.718
 I - m - m - -  t  155  years before  1.015  1.078  1.162  1.252  1.350  1.455  1.568  1.822  2.117  2.460  3.320 4.482
 -”  0  2 years before  1.020  1.105  1.221  1.350  1.492  1.649  1.822  2.226  2.718  3.320  4.953 7.389
 l.O(e’n)  =  C,  3 years before  1.030  1.162  1.350  1.568  1.822  2.117  2.460  3.320  4.482  6.050  1.02320.086
                             _
  -_                   --                -       -
 (f) Occur uniformly before  t.he  refer-
 ence point
 F.W.  !s  year before  1.002  1.013  1.025  1.038  1.052  1.065  1.079  1.107  1.136  1.166  1.230  1.297
 1 year before  1.005  1.025  1.052  1.079  1.107  1.136  1.166  1.230  1.297  1.370  1.532  1.718
 135  years before  1.008  1.038  1.079  1.121  1.166  1.213  1.263  1.370  i.489  1.622  1.933  2.321
 2 years before  1.010  1.052  1.107  1.166  1.230  1.297  1.370  1.532  1.718  1.933  2.471  3.194
 3 years before  1.015  1.079  1.166  1.263  1.370  1.489  1.622  1.933  2.321  2.805  4.176  6.362

 t  r  =  nominal interest compounded continuously, percent/190;   n  = number of years; T  and  nr  =  number of years in a time period.
 See Table 4 for significance and meaning of compounding factors.  Extended values of factors for parts (a), (b), and (d) are given
 in Tables 5, 6, and 8, and Table 7 gives extended values for part (c) with R  = T.
 ii