Page 199 - Plant-Based Remediation Processes
P. 199

10  Phytostabilization as Soil Remediation Strategy             191

                     a     700                              a
                         Total Cu in plant tissues (mg kg -1 )  400  e b  cd  b d  b e  bc  a  ab
                           600
                           500

                           300
                           200
                                                       b
                           100
                                       b
                                                                 ab
                             0
                                                           HIGH
                                           LOW
                     b    2800  Control  Cu  Cu/Zn  Cu/Cr  Cu  Cu/Zn  Cu/Cr
                         Total Zn in plant tissues (mg kg -1 )  1600  c g  Zn  Cu/Zn  Zn/Cr  ab b  Cu/Zn  Zn/Cr
                                  Shoots-Leaves
                                  Roots
                          2400
                          2000
                                                            a
                                                                 ab
                          1200
                           800
                                                            a
                                           bc
                                      bc
                                                 c
                           400
                                                                 c
                                            d
                                                 f
                                       e
                             0
                                                      Zn
                         Total Cr in plant tissues (mg kg -1 )  120  a  b c  b d  b f  a  b  b e
                     c     200  Control    LOW         b   HIGH
                           160
                                                            b
                            80
                            40
                             0
                                 g
                                                           HIGH
                                Control  Cr  Cu/Cr  Zn/Cr  Cr  Cu/Cr  Zn/Cr
                                           LOW
                                             Soil Treatment
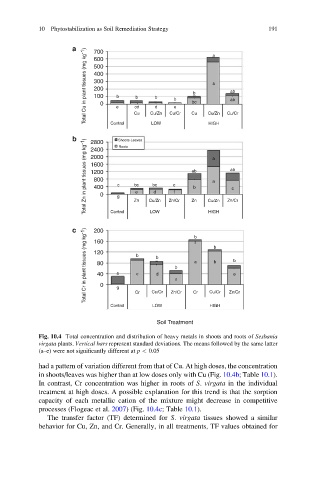
            Fig. 10.4 Total concentration and distribution of heavy metals in shoots and roots of Sesbania
            virgata plants. Vertical bars represent standard deviations. The means followed by the same latter
            (a–e) were not significantly different at p < 0.05

            had a pattern of variation different from that of Cu. At high doses, the concentration
            in shoots/leaves was higher than at low doses only with Cu (Fig. 10.4b; Table 10.1).
            In contrast, Cr concentration was higher in roots of S. virgata in the individual
            treatment at high doses. A possible explanation for this trend is that the sorption
            capacity of each metallic cation of the mixture might decrease in competitive
            processes (Flogeac et al. 2007) (Fig. 10.4c; Table 10.1).
              The transfer factor (TF) determined for S. virgata tissues showed a similar
            behavior for Cu, Zn, and Cr. Generally, in all treatments, TF values obtained for
   194   195   196   197   198   199   200   201   202   203   204