
Page 445 - Polymer-based Nanocomposites for Energy and Environmental Applications
P. 445
402 Polymer-based Nanocomposites for Energy and Environmental Applications
Fig. 14.4 TCP method for biofilm detection (A) 24-well plate for biofilm detection.
(B) Polymer composite films (silver nanoparticle coated and uncoated) in contact with a log-
phase biofilm-forming E. coli culture. (C) Crystal violet assay after 48 h of incubation of silver-
coated and uncoated composite films.
14.3.5 Spectrophotometric analysis
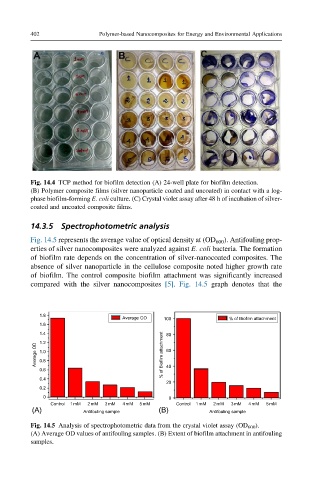
Fig. 14.5 represents the average value of optical density at (OD 600 ). Antifouling prop-
erties of silver nanocomposites were analyzed against E. coli bacteria. The formation
of biofilm rate depends on the concentration of silver-nanocoated composites. The
absence of silver nanoparticle in the cellulose composite noted higher growth rate
of biofilm. The control composite biofilm attachment was significantly increased
compared with the silver nanocomposites [5]. Fig. 14.5 graph denotes that the
1.8
Average OD 100 % of Biofilm attachment
1.6
1.4 80
1.2
Average OD 1.0 % of Biofilm attachment 60
0.8
0.6 40
0.4
20
0.2
0 0
Control 1mM 2mM 3mM 4mM 5 mM Control 1mM 2mM 3mM 4mM 5mM
(A) Antifouling sample (B) Antifouling sample
Fig. 14.5 Analysis of spectrophotometric data from the crystal violet assay (OD 600 ).
(A) Average OD values of antifouling samples. (B) Extent of biofilm attachment in antifouling
samples.