
Page 363 - Power Electronic Control in Electrical Systems
P. 363
//SYS21/F:/PEC/REVISES_10-11-01/075065126-CH008.3D ± 346 ± [290±372/83] 17.11.2001 10:29AM
346 Transient studies of FACTS and Custom Power equipment
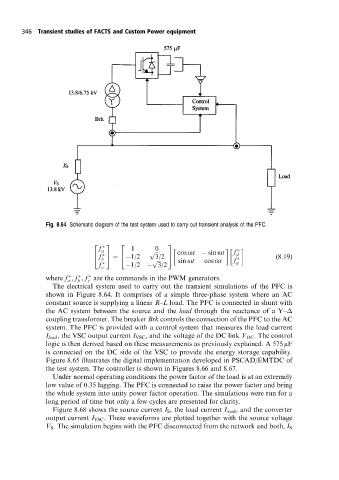
Fig. 8.64 Schematic diagram ofthe test system used to carry out transient analysis of the PFC.
2 3 2 3
f a 1 p 0 f
f cos ot sin ot d
4 5 4 1/2 3/2 5 (8:19)
b p sin ot cos ot f
f c 1/2 3/2 q
where f , f , f are the commands in the PWM generators.
a b c
The electrical system used to carry out the transient simulations of the PFC is
shown in Figure 8.64. It comprises of a simple three-phase system where an AC
constant source is supplying a linear R±L load. The PFC is connected in shunt with
the AC system between the source and the load through the reactance of a Y±
coupling transformer. The breaker Brk controls the connection of the PFC to the AC
system. The PFC is provided with a control system that measures the load current
I load , the VSC output current I VSC , and the voltage of the DC link V DC . The control
logic is then derived based on these measurements as previously explained. A 575 mF
is connected on the DC side of the VSC to provide the energy storage capability.
Figure 8.65 illustrates the digital implementation developed in PSCAD/EMTDC of
the test system. The controller is shown in Figures 8.66 and 8.67.
Under normal operating conditions the power factor of the load is at an extremely
low value of 0.35 lagging. The PFC is connected to raise the power factor and bring
the whole system into unity power factor operation. The simulations were run for a
long period of time but only a few cycles are presented for clarity.
Figure 8.68 shows the source current I S , the load current I load , and the converter
output current I VSC . These waveforms are plotted together with the source voltage
V S . The simulation begins with the PFC disconnected from the network and both, I S