
Page 366 - Power Electronic Control in Electrical Systems
P. 366
//SYS21/F:/PEC/REVISES_10-11-01/075065126-CH008.3D ± 348 ± [290±372/83] 17.11.2001 10:29AM
348 Transient studies of FACTS and Custom Power equipment
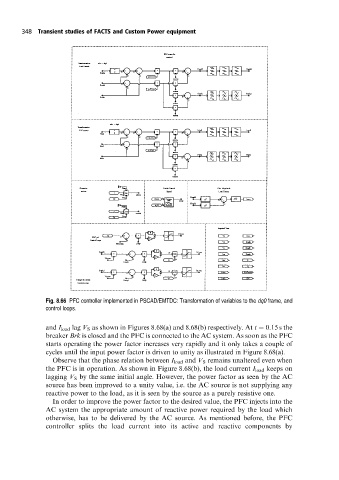
Fig. 8.66 PFC controller implemented in PSCAD/EMTDC: Transformation of variables to the dq0 frame, and
control loops.
and I load lag V S as shown in Figures 8.68(a) and 8.68(b) respectively. At t 0:15 s the
breaker Brk is closed and the PFC is connected to the AC system. As soon as the PFC
starts operating the power factor increases very rapidly and it only takes a couple of
cycles until the input power factor is driven to unity as illustrated in Figure 8.68(a).
Observe that the phase relation between I load and V S remains unaltered even when
the PFC is in operation. As shown in Figure 8.68(b), the load current I load keeps on
lagging V S by the same initial angle. However, the power factor as seen by the AC
source has been improved to a unity value, i.e. the AC source is not supplying any
reactive power to the load, as it is seen by the source as a purely resistive one.
In order to improve the power factor to the desired value, the PFC injects into the
AC system the appropriate amount of reactive power required by the load which
otherwise, has to be delivered by the AC source. As mentioned before, the PFC
controller splits the load current into its active and reactive components by