
Page 169 - Power Quality in Electrical Systems
P. 169
Dynamic Voltage Compensators 151
Operation on ITIC curve
With a relatively limited range of operation, the dynamic voltage com-
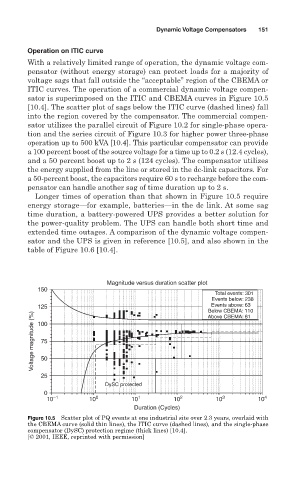
pensator (without energy storage) can protect loads for a majority of
voltage sags that fall outside the “acceptable” region of the CBEMA or
ITIC curves. The operation of a commercial dynamic voltage compen-
sator is superimposed on the ITIC and CBEMA curves in Figure 10.5
[10.4]. The scatter plot of sags below the ITIC curve (dashed lines) fall
into the region covered by the compensator. The commercial compen-
sator utilizes the parallel circuit of Figure 10.2 for single-phase opera-
tion and the series circuit of Figure 10.3 for higher power three-phase
operation up to 500 kVA [10.4]. This particular compensator can provide
a 100 percent boost of the source voltage for a time up to 0.2 s (12.4 cycles),
and a 50 percent boost up to 2 s (124 cycles). The compensator utilizes
the energy supplied from the line or stored in the dc-link capacitors. For
a 50-percent boost, the capacitors require 60 s to recharge before the com-
pensator can handle another sag of time duration up to 2 s.
Longer times of operation than that shown in Figure 10.5 require
energy storage—for example, batteries—in the dc link. At some sag
time duration, a battery-powered UPS provides a better solution for
the power-quality problem. The UPS can handle both short time and
extended time outages. A comparison of the dynamic voltage compen-
sator and the UPS is given in reference [10.5], and also shown in the
table of Figure 10.6 [10.4].
Magnitude versus duration scatter plot
150
Total events: 301
Events below: 238
Events above: 63
125 Below CBEMA: 110
Voltage magnitude (%) 100
Above CBEMA: 61
75
50
25
DySC protected
0
10 –1 10 0 10 1 10 2 10 3 10 4
Duration (Cycles)
Figure 10.5 Scatter plot of PQ events at one industrial site over 2.3 years, overlaid with
the CBEMA curve (solid thin lines), the ITIC curve (dashed lines), and the single-phase
compensator (DySC) protection regime (thick lines) [10.4].
[© 2001, IEEE, reprinted with permission]