
Page 63 - Power Quality in Electrical Systems
P. 63
46 Chapter Four
1
0
−1
0 0.005 0.01 0.015 0.02 0.025 0.03
1
0
−1
0 0.005 0.01 0.015 0.02 0.025 0.03
1
0
−1
0 0 0.005 0.01 0.015 0.02 0.025 0.03
1
0
−1
0 0.005 0.01 0.015 0.02 0.025 0.03
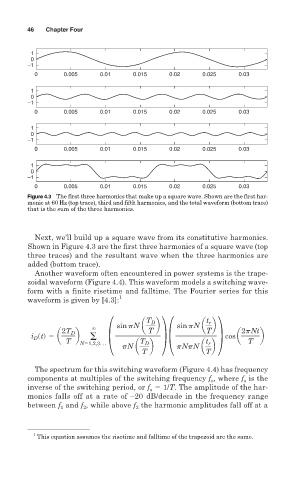
Figure 4.3 The first three harmonics that make up a square wave. Shown are the first har-
monic at 60 Hz (top trace), third and fifth harmonics, and the total waveform (bottom trace)
that is the sum of the three harmonics.
Next, we’ll build up a square wave from its constitutive harmonics.
Shown in Figure 4.3 are the first three harmonics of a square wave (top
three traces) and the resultant wave when the three harmonics are
added (bottom trace).
Another waveform often encountered in power systems is the trape-
zoidal waveform (Figure 4.4). This waveform models a switching wave-
form with a finite risetime and falltime. The Fourier series for this
waveform is given by [4.3]: 1
T D t r
sinpN a b sinpN a b
`
2T D T T 2pNt
i std 5 a b ± ≤± ≤ cos a b
D
T T D t r T
pN a b pNpN a b
N51,2,3c
T T
The spectrum for this switching waveform (Figure 4.4) has frequency
components at multiples of the switching frequency f , where f is the
o
o
inverse of the switching period, or f 1/T. The amplitude of the har-
o
monics falls off at a rate of –20 dB/decade in the frequency range
between f and f , while above f the harmonic amplitudes fall off at a
2
1
2
1
This equation assumes the risetime and falltime of the trapezoid are the same.