
Page 71 - Power Quality in Electrical Systems
P. 71
54 Chapter Four
+1.0
t
−1.0
(a)
+1.0
t
−1.0
(b)
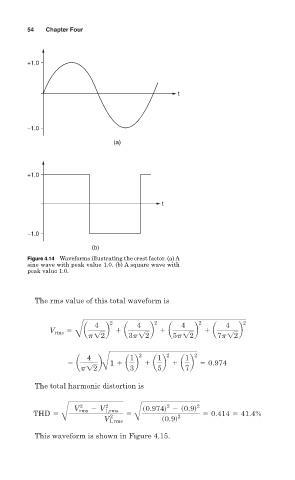
Figure 4.14 Waveforms illustrating the crest factor. (a) A
sine wave with peak value 1.0. (b) A square wave with
peak value 1.0.
The rms value of this total waveform is
4 2 4 2 4 2 4 2
5 a b 1 a b 1 a b 1 a b
V rms
É p!2 3p!2 5p!2 7p!2
4 1 2 1 2 1 2
5 a b 1 1 a b 1 a b 1 a b 5 0.974
p!2 Å 3 5 7
The total harmonic distortion is
2
2
2
V rms 2 V 1,rms s0.974d 2 s0.9d 2
THD 5 2 5 2 5 0.414 5 41.4%
Å V 1,rms Å s0.9d
This waveform is shown in Figure 4.15.