
Page 75 - Power Quality in Electrical Systems
P. 75
58 Chapter Four
1.0 A
0 A
−1.0 A
I(I1) I(I3)
2.0 A
0 A
−2.0 A
0 ms 5 ms 10 ms 15 ms 20 ms 25 ms 30 ms 35 ms 40 ms
I(R1) Time
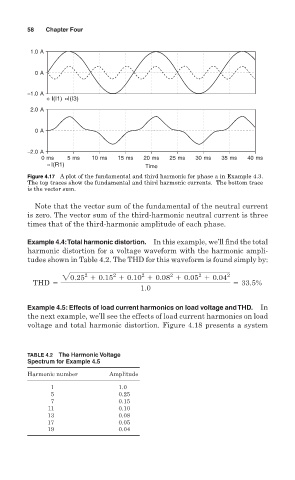
Figure 4.17 A plot of the fundamental and third harmonic for phase a in Example 4.3.
The top traces show the fundamental and third harmonic currents. The bottom trace
is the vector sum.
Note that the vector sum of the fundamental of the neutral current
is zero. The vector sum of the third-harmonic neutral current is three
times that of the third-harmonic amplitude of each phase.
Example 4.4:Total harmonic distortion. In this example, we’ll find the total
harmonic distortion for a voltage waveform with the harmonic ampli-
tudes shown in Table 4.2. The THD for this waveform is found simply by:
2
2
2
2
2
20.25 1 0.15 1 0.10 1 0.08 1 0.05 1 0.04 2
THD 5 5 33.5%
1.0
Example 4.5: Effects of load current harmonics on load voltage and THD. In
the next example, we’ll see the effects of load current harmonics on load
voltage and total harmonic distortion. Figure 4.18 presents a system
TABLE 4.2 The Harmonic Voltage
Spectrum for Example 4.5
Harmonic number Amplitude
1 1.0
5 0.25
7 0.15
11 0.10
13 0.08
17 0.05
19 0.04