
Page 37 - Practical Control Engineering a Guide for Engineers, Managers, and Practitioners
P. 37
12 Chapter One
1.2
I ; -No control
0.6 ... ·· Frontonly
~ I - - Front, mid & rear
=' 0.4
0
II)
~ 0.2
c..
0
-0.2
-0.4
-0.6
0 50 150 200
Time
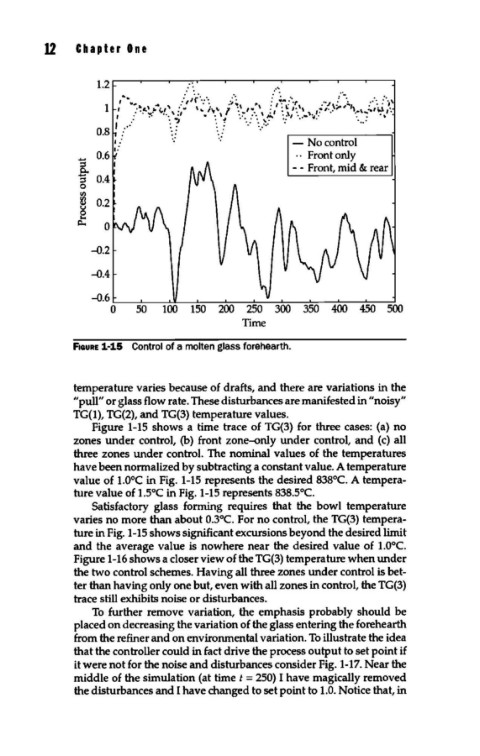
FIGURE 1-15 Control of a molten glass forehearth.
temperature varies because of drafts, and there are variations in the
"pull" or glass flow rate. These disturbances are manifested in "noisy"
TG(1), TG(2), and TG(3) temperature values.
Figure 1-15 shows a time trace of TG(3) for three cases: (a) no
zones under control, (b) front zon~nly under control, and (c) all
three zones under control. The nominal values of the temperatures
have been normalized by subtracting a constant value. A temperature
value of 1.0°C in Fig. 1-15 represents the desired 838°C. A tempera-
ture value of 1.5°C in Fig. 1-15 represents 838.5°C.
Satisfactory glass forming requires that the bowl temperature
varies no more than about 0.3°C. For no control, the TG(3) tempera-
ture in Fig. 1-15 shows significant excursions beyond the desired limit
and the average value is nowhere near the desired value of 1.0°C.
Figure 1-16 shows a closer view of the TG(3) temperature when under
the two control schemes. Having all three zones under control is bet-
ter than having only one but, even with all zones in control, the TG(3)
trace still exhibits noise or disturbances.
To further remove variation, the emphasis probably should be
placed on decreasing the variation of the glass entering the forehearth
from the refiner and on environmental variation. To illustrate the idea
that the controller could in fact drive the process output to set point if
it were not for the noise and disturbances consider Fig. 1-17. Near the
middle of the simulation (at timet= 250) I have magically removed
the disturbances and I have changed to set point to 1.0. Notice that, in