
Page 545 - Practical Design Ships and Floating Structures
P. 545
520
If one compares Table 1 with Figure 1, one notices immediately that the resistance of a surface coated
with a Foul Release system does not correlate with the roughness parameter Rt50.
Consequently, a UBM optical measurement system was used to analyse small sample plates (20 by
25cm) coated with the two paint systems described in the previous section. The instrument works by
the focus-detection principle whereby the vertical displacement of the objective is measured by an
infrared laser diode as light source. The instrument has a vertical range of 0.5mm and a resolution of
less than 50nm.
The roughness of the surfaces has been investigated by analysing a wide range of parameters. The
amplitude parameters, characterising how the roughness varies at right angles to the surface, can be
subdivided into extreme-value parameters (e.g. Rt), average parameters and properties of the height
distribution. Texture parameters, which describe how the roughness varies in the plane of the surface,
included counts of extrema and crossings with the mean line, the average absolute slope Sa, and the
correlation length T. A fractal approach, which essentially scrutinises the surface for self-similarity,
was included by computing the fractal dimension.
The measurements were carried out for a range of long wavelength cut-offs and sampling intervals
(equal to half the Nyquist short wavelength cut-oft). In accordance to the standards for roughness
measurement as suggested by Medhurst (1 990), 3 transversal and 3 longitudinal measurements were
taken for each set of bandwidth parameters.
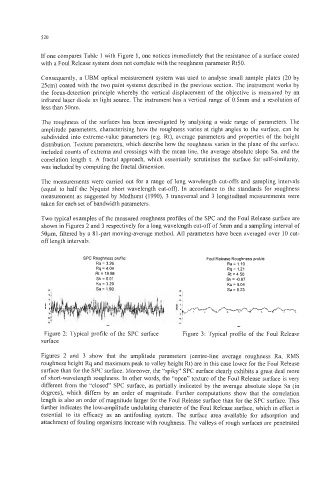
Two typical examples of the measured roughness profiles of the SPC and the Foul Release surface are
shown in Figures 2 and 3 respectively for a long wavelength cut-off of 5mm and a sampling interval of
50pm, filtered by a 81-part moving-average method. All parameters have been averaged over 10 cut-
off length intervals.
SPC Roughness profile: Foul Release Roughness profile:
Ra = 3.26 Ra= 1.10
Rq = 4.04 Rq=1.21
Rt = 19.98 Rt = 4.50
Sk = 0.01 Sk = -0.87
KU = 3.29 Ku = 5.04
Sa = 1.90 Sa = 0.23
-
“I I5 1 “.%
Figure 2: Typical profile of the SPC surface Figure 3: Typical profile of the Foul Release
surface
Figures 2 and 3 show that the amplitude parameters (centre-line average roughness Ra, RMS
roughness height Rq and maximum peak to valley height Rt) are in this case lower for the Foul Release
surface than for the SPC surface. Moreover, the “spiky” SPC surface clearly exhibits a great deal more
of short-wavelength roughness. In other words, the “open” texture of the Foul Release surface is very
different from the “closed” SPC surface, as partially indicated by the average absolute slope Sa (in
degrees), which differs by an order of magnitude. Further computations show that the correlation
length is also an order of magnitude larger for the Foul Release surface than for the SPC surface. This
further indicates the low-amplitude undulating character of the Foul Release surface, which in effect is
essential to its efficacy as an antifouling system. The surface area available for adsorption and
attachment of fouling organisms increase with roughness. The valleys of rough surfaces are penetrated