
Page 544 - Practical Design Ships and Floating Structures
P. 544
519
like material, whereas if the surface was too wet, the gauge skidded very easily; both practices would
give erroneous readings (Anderson et al., 1999). Table 1 presents the average roughness in microns for
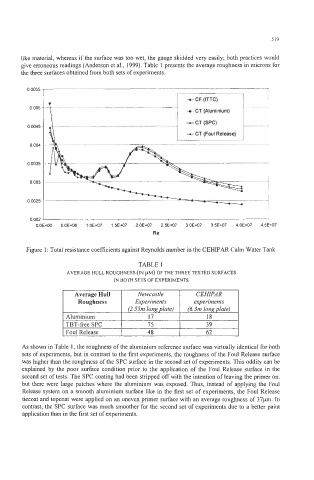
the three surfaces obtained from both sets of experiments.
0 0045
- CT (Foul Release)
0 004
0.0035
0 003
0.0025
O.OE+OO 5.OE+06 1 .OE+07 1.5E+07 2.OE+07 2.5E+07 3.OE+07 3.5E+07 4.OE+07 4.5E+07
Re
Figure 1 : Total resistance coefficients against Reynolds number in the CEHIPAR Calm Water Tank
TABLE 1
AVERAGE HULL ROUGHNESS (IN FM) OF THE THREE TESTED SURFACES
IN BOTH SETS OF EXPERIMENTS
Average Hull Newcastle CEHIPAR
Roughness experiments
Aluminium
TRT-free SPC 75 39
I Foul Release 48 62
As shown in Table 1, the roughness of the aluminium reference surface was virtually identical for both
sets of experiments, but in contrast to the first experiments, the roughness of the Foul Release surface
was higher than the roughness of the SPC surface in the second set of experiments. This oddity can be
explained by the poor surface condition prior to the application of the Foul Release surface in the
second set of tests. The SPC coating had been stripped off with the intention of leaving the primer on,
but there were large patches where the aluminium was exposed. Thus, instead of applying the Foul
Release system on a smooth aluminium surface like in the first set of experiments, the Foul Release
tiecoat and topcoat were applied on an uneven primer surface with an average roughness of 37pm. In
contrast, the SPC surface was much smoother for the second set of experiments due to a better paint
application than in the first set of experiments.