
Page 547 - Practical Design Ships and Floating Structures
P. 547
522
taken as the value measured by the BMT Hull Roughness Analyser. It is believed that the effect of the
poor surface preparation was less significant on the absolute slope and the curvature of the surface, but
the data could possibly shift slightly towards the right. Further investigation and the acquisition of
more data is needed to validate the trends observed in Figure 4.
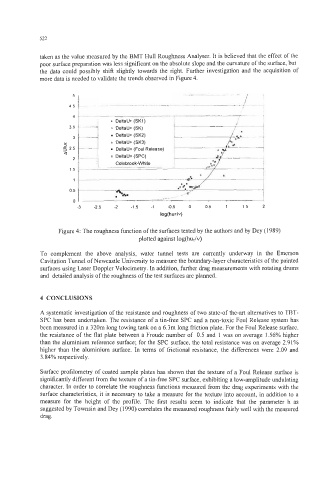
0 DeRaU+ (SK)
DeltaU+ (SK2)
a DeltaU+ (SK3)
= DeitaU+ (Foul Release)
-3 -25 -2 -15 -1 -05 0 05 1 15 2
log(hur/v)
Figure 4: The roughness function of the surfaces tested by the authors and by Dey (1 989)
plotted against log(hu,/v)
To complement the above analysis, water tunnel tests are currently underway in the Emerson
Cavitation Tunnel of Newcastle University to measure the boundary-layer characteristics of the painted
surfaces using Laser Doppler Velocimetry. In addition, further drag measurements with rotating drums
and detailed analysis of the roughness of the test surfaces are planned.
4 CONCLUSIONS
A systematic investigation of the resistance and roughness of two state-of the-art alternatives to TBT-
SPC has been undertaken. The resistance of a tin-free SPC and a non-toxic Foul Release system has
been measured in a 320m long towing tank on a 6.3m long friction plate. For the Foul Release surface,
the resistance of the flat plate between a Froude number of 0.5 and 1 was on average 1.56% higher
than the aluminium reference surface; for the SPC surface, the total resistance was on average 2.91%
higher than the aluminium surface. In terms of frictional resistance, the differences were 2.09 and
3.84% respectively.
Surface profilometry of coated sample plates has shown that the texture of a Foul Release surface is
significantly different from the texture of a tin-free SPC surface, exhibiting a low-amplitude undulating
character. In order to correlate the roughness functions measured from the drag experiments with the
surface characteristics, it is necessary to take a measure for the texture into account, in addition to a
measure for the height of the profile. The first results seem to indicate that the parameter h as
suggested by Townsin and Dey (1 990) correlates the measured roughness fairly well with the measured
drag.