
Page 546 - Practical Design Ships and Floating Structures
P. 546
52 1
by marine adhesives and hence foulants will more readily attach. Moreover, the foulants also find
shelter from shear and abrasion in the crevices and thus roughness also poses a threat to the
hydrodynamical removal of the organisms.
3 CORRELATION OF THE ROUGHNESS AND DRAG
Townsin and Dey (I 990) correlated the roughness and drag of a very wide range of coated surfaces and
found that the resistance of smooth newly painted surfaces correlated well with the parameter Rt50.
Their main argument for the use of a single height parameter to characterise the roughness was that the
texture of a newly painted surface must depend principally on the rheology of the paint. There is no in-
service damage which might affect the texture and only a height parameter is required to differentiate
one from another. This argument may hold for newly painted SPC surfaces, but it does not hold for
Foul Release surfaces since its surface texture is already significantly different immediately after
application.
Townsin and Dey (1990) had found that a composite roughness parameter, h, correlated well with the
drag increase of the entire range of painted surfaces. The parameter h is equal to mo(m4/mz)0 ’ whereby
mo, mz and are the first even spectral moments of the roughness profile, which are directly related
to the variances of the height, slope and curvature respectively. The drag increase is characterised by
the roughness function AU/u, as defined by Hama (1954). Granville’s indirect method was used to
convert the total drag as measured from the towing tank experiments to the roughness function at the
trailing edge, using the equation (Granville, 1987):
The frictional resistance of the rough, painted surfaces is subtracted from the smooth aluminium
reference values at equal values of ReCF. The frictional resistance coefficients CF were obtained from
subtracting the wave resistance coefficients, as computed by a dedicated computational fluid dynamics
tool, from the measured total resistance coefficients shown in Figure 1. The frictional resistance of the
aluminium reference surface was found to be in excellent agreement with the Schoenherr friction line.
Consequently, iteration of the Schoenherr equation was carried out to obtain (~/CF)’-’ of the aluminium
surface at the respective ReCF values of the painted surfaces. The associated value of the roughness
Reynolds number h’ = hu,/v for the given value of ReCF is then applied with the h values obtained
from the optical roughness measurement:
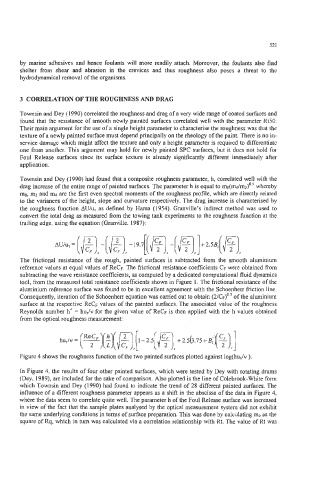
Figure 4 shows the roughness function of the two painted surfaces plotted against log(hu,/v ).
In Figure 4, the results of four other painted surfaces, which were tested by Dey with rotating drums
(Dey, 1989), are included for the sake of comparison. Also plotted is the line of Colebrook-White form
which Townsin and Dey (1990) had found to indicate the trend of 28 different painted surfaces. The
influence of a different roughness parameter appears as a shift in the abscissa of the data in Figure 4,
where the data seem to correlate quite well. The parameter h of the Foul Release surface was increased
in view of the fact that the sample plates analysed by the optical measurement system did not exhibit
the same underlying conditions in terms of surface preparation. This was done by calculating mo as the
square of Rq, which in turn was calculated via a correlation relationship with Rt. The value of Rt was