
Page 110 - Practical Design Ships and Floating Structures
P. 110
85
CATA I CATAII
-
...-.....- UTA I
CATAII
0.4
02
0.0
5 10 M
Statbn
1 R 1
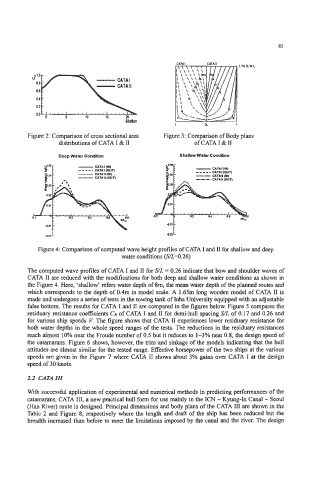
Figure 2: Comparison of cross sectional area Figure 3: Comparison of Body plans
distributions of CATA I & I1 of CATA I & I1
Deep Water Condition Shallow Water Condition
sE - (IN) 8"" - (IU)
- 0-
CATA
I
I
UTA
----- UTAIIOUT)
CATAll
--I (IN)
UTA11
F[ - IOUT)
4.d
Figure 4: Comparison of computed wave height profiles of CATA I and 11 for shallow and deep
water conditions (S/L=0.26)
The computed wave profiles of CATA I and II for S/L = 0.26 indicate that bow and shoulder waves of
CATA I1 are reduced with the modifications for both deep and shallow water conditions as shown in
the Figure 4. Here, 'shallow' refers water depth of 8m, the mean water depth of the planned routes and
which corresponds to the depth of 0.4m in model scale. A 1.65m long wooden model of CATA I1 is
made and undergoes a series of tests in the towing tank of Inha University equipped with an adjustable
false bottom. The results for CATA I and I1 are compared in the figures below. Figure 5 compares the
residuary resistance coefficients CR of CATA I and I1 for demi-hull spacing S/L of 0.17 and 0.26 and
for various ship speeds V. The figure shows that CATA I1 experiences lower residuary resistance for
both water depths in the whole speed ranges of the tests. The reductions in the residuy resistances
reach almost 10% near the Froude number of 0.5 but it reduces to 1-3% near 0.8, the design speed of
the catamarans. Figure 6 shows, however, the trim and sinkage of the models indicating that the hull
attitudes are almost similar for the tested range. Effective horsepower of the two ships at the various
speeds are given in the Figure 7 where CATA I1 shows about 3% gains over CATA I at the design
speed of 30 knots.
2.2 CATA III
With successful application of experimental and numerical methods in predicting performances of the
catamarans, CATA 111, a new practical hull form for use mainly in the ICN - Kyung-In Canal - Seoul
(Han River) route is designed. Principal dimensions and body plans of the CATA 111 are shown in the
Table 2 and Figure 8, respectively where the length and dr& of the ship has been reduced but the
breadth increased than before to meet the limitations imposed by the canal and the river. The design