
Page 209 - Practical Design Ships and Floating Structures
P. 209
184
0
0
0
0 G
E
Y
c
M
Y,
-
0 W M
0
0
d
VI
VI
e
G
0
0
I.E+04 l.E+05 I.E+06 I.E+07 1.EN8
Endurance (cycles)
Lung-am mdizd
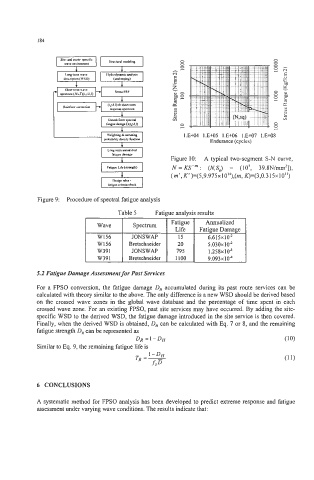
Figure 10: A typical two-segment S-N curve,
N = KS-"': (NS,,) = (lo', 39.8N/mm2]),
(m', K')=(5,9.975~1O'~),(rn, K)=(3,0.3 15x10")
Figure 9: Procedure of spectral fatigue analysis
Table 5 Fatigue analysis results
Spectrum
JONSWAP 6.615~10'~
W391 JONSWAP 1.258~10"
w391 9.093~10~
5.2 Fatigue Damage Assessment for Past Services
For a FPSO conversion, the fatigue damage D, accumulated during its past route services can be
calculated with theory similar to the above. The only difference is a new WSD should be derived based
on the crossed wave zones in the global wave database and the percentage of time spent in each
crossed wave zone. For an existing FPSO, past site services may have occurred. By adding the site-
specific WSD to the derived WSD, the fatigue damage introduced in the site service is then covered.
Finally, when the derived WSD is obtained, D, can be calculated with Eq. 7 or 8, and the remaining
fatigue strength DR can be represented as
DR =I-DH (10)
Similar to Eq. 9, the remaining fatigue life is
6 CONCLUSIONS
A systematic method for FPSO analysis has been developed to predict extreme response and fatigue
assessment under varying wave conditions. The results indicate that: