
Page 204 - Practical Design Ships and Floating Structures
P. 204
119
0 5 10 IS 20
TP (W
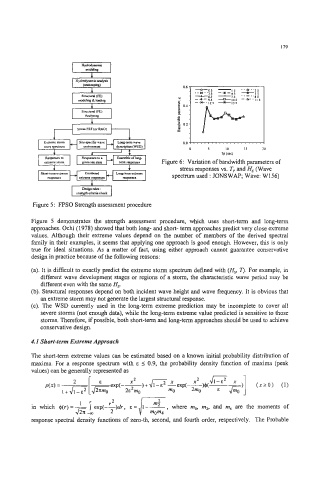
Figure 6: Variation of bandwidth parameters of
stress responses vs. T, and H, (Wave
spectrum used : JONSWAP; Wave: W156)
Figure 5: FPSO Strength assessment procedure
Figure 5 demonstrates the strength assessment procedure, which uses short-term and long-term
approaches. Ochi (I 978) showed that both long- and short- term approaches predict very close extreme
values. Although their extreme values depend on the number of members of the derived spectral
family in their examples, it seems that applying one approach is good enough. However, this is only
true for ideal situations. As a matter of fact, using either approach cannot guarantee conservative
design in practice because of the following reasons:
(a). It is dificult to exactly predict the extreme storm spectrum defined with (I&, 2). For example, in
different wave development stages or regions of a storm, the characteristic wave period may be
different even with the same H,.
(b). Structural responses depend on both incident wave height and wave frequency. It is obvious that
an extreme storm may not generate the largest structural response.
(c). The WSD currently used in the long-term extreme prediction may be incomplete to cover all
severe storms (not enough data), while the long-term extreme value predicted is sensitive to those
storms. Therefore, if possible, both short-term and long-term approaches should be used to achieve
conservative design.
4.1 Short-term Extreme Approach
The short-term extreme values can be estimated based on a known initial probability distribution of
maxima. For a response spectrum with E 5 0.9, the probability density function of maxima (peak
values) can be generally represented as
..
"0 2"o
2 i
1 ' r2 2
,
in which +(r) = - exp(--)dr , E = 1 -* mo, m,, and m4 are the moments of
where
45.43 "O"4
response spectral density functions of zero-th, second, and fourth order, respectively. The Probable