
Page 201 - Practical Design Ships and Floating Structures
P. 201
176
basically not reliable if the Weibull parameters are not exactly known. Providing accurate values for
the Weibull parameters in advance is very difficult because these values are environment and response
dependent (Chen, 1988). In this paper, closed-form spectral fatigue integration is applied.
2 WAVE CONDITIONS
Wave conditions used in the strength and fatigue assessment should cover all operational modes,
including normal operation, transition, and extreme-storm survival conditions. In the following
discussion, both short-term and long-term descriptions of sea states are used.
The slowly varying local sea state can be reasonably assumed to be stationary in a 'short' time interval,
for instance, in a three-hour duration. A sea state is usually described by a wave spectrum, which
describes only a short-term sea state. The extreme value based on a short-term sea state is referred to
as shorf-term extreme. In predicting extreme responses by the short-term method, an family of
'extreme' storm wave spectra based on long-term wave statistics is usually required as the short-term
sea states.
Suitable wave spectra should be chosen to represent the waves for different geographical regions and
wave development stages. For example, the Bretschneider wave spectrum is usually employed to
describe tropical storm waves, such as those generated by hurricanes in the Gulf of Mexico or
typhoons in the South China Sea. The JONSWAP wave spectrum is used to describe winter storm
waves of the North Sea. Both Bretschneider and JONWASP (y=3.3) wave spectra are used in the
following examples to investigate their effects on extreme values and fatigue damage.
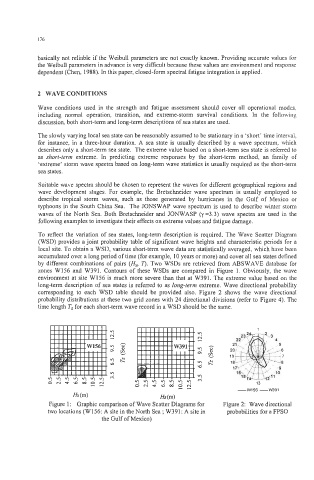
To reflect the variation of sea states, long-term description is required. The Wave Scatter Diagram
(WSD) provides a joint probability table of significant wave heights and characteristic periods for a
local site. To obtain a WSD, various short-term wave data are statistically averaged, which have been
accumulated over a long period of time (for example, 10 years or more) and cover all sea states defined
by different combinations of pairs (Hs, r). Two WSDs are retrieved from ABSWAVE database for
zones W156 and W391. Contours of these WSDs are compared in Figure 1. Obviously, the wave
environment at site W156 is much more severe than that at W391. The extreme value based on the
long-term description of sea states is referred to as long-term extreme. Wave directional probability
corresponding to each WSD table should be provided also. Figure 2 shows the wave directional
probability distributions at these two grid zones with 24 directional divisions (refer to Figure 4). The
time length T, for each short-term wave record in a WSD should be the same.
1
h h 2
0
0
z5 e, 20 6
0
0
rt: rt: 19 8 7
ia
1
13
-W156 -W91
Hs (m) Hs (m)
Figure 1 : Graphic comparison of Wave Scatter Diagrams for Figure 2: Wave directional
two locations (W156: A site in the North Sea ; W391: A site in probabilities for a FPSO
the Gulf of Mexico)