
Page 240 - Practical Design Ships and Floating Structures
P. 240
215
Ara Riv. I
6
Bt Mega-Float model
- Breakwater
A-K: Station
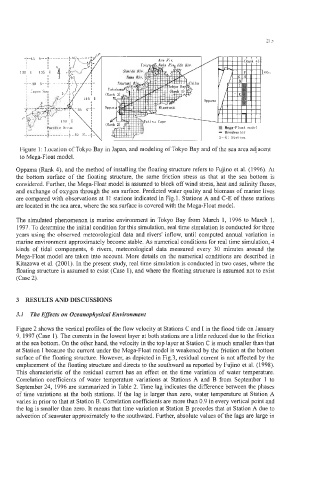
Figure 1: Location of Tokyo Bay in Japan, and modeling of Tokyo Bay and of the sea area adjacent
to Mega-Float model.
Oppama (Rank 4), and the method of installing the floating structure refers to Fujino et al. (1996). At
the bottom surface of the floating structure, the same friction stress as that at the sea bottom is
considered. Further, the Mega-Float model is assumed to block off wind stress, heat and salinity fluxes,
and exchange of oxygen through the sea surface. Predicted water quality and biomass of marine lives
are compared with observations at 11 stations indicated in Fig. 1. Stations A and C-E of these stations
are located in the sea area, where the sea surface is covered with the Mega-Float model.
The simulated phenomenon is marine environment in Tokyo Bay from March 1, 1996 to March 1,
1997. To determine the initial condition for this simulation, real time simulation is conducted for three
years using the observed meteorological data and rivers’ inflow, until computed annual variation in
marine environment approximately become stable. As numerical conditions for real time simulation, 4
kinds of tidal components, 6 rivers, meteorological data measured every 30 minutes around the
Mega-Float model are taken into account. More details on the numerical conditions are described in
Kitazawa et al. (2001). In the present study, real time simulation is conducted in two cases, where the
floating structure is assumed to exist (Case I), and where the floating structure is assumed not to exist
(Case 2).
3 RESULTS AND DISCUSSIONS
3.1 The Eflects on Oceanophysical Environment
Figure 2 shows the vertical profiles of the flow velocity at Stations C and I in the flood tide on January
9, 1997 (Case 1). The currents in the lowest layer at both stations are a little reduced due to the friction
at the sea bottom. On the other hand, the velocity in the top layer at Station C is much smaller than that
at Station I because the current under the Mega-Float model is weakened by the friction at the bottom
surface of the floating structure. However, as depicted in Fig.3, residual current is not affected by the
emplacement of the floating structure and directs to the southward as reported by Fujino et al. (1998).
This characteristic of the residual current has an effect on the time variation of water temperature.
Correlation coefficients of water temperature variations at Stations A and B from September 1 to
September 24, 1996 are summarized in Table 2. Time lag indicates the difference between the phases
of time variations at the both stations. If the lag is larger than zero, water temperature at Station A
varies in prior to that at Station B. Correlation coefficients are more than 0.9 in every vertical point and
the lag is smaller than zero. It means that time variation at Station B precedes that at Station A due to
advection of seawater approximately to the southward. Further, absolute values of the lags are large in