
Page 241 - Practical Design Ships and Floating Structures
P. 241
216
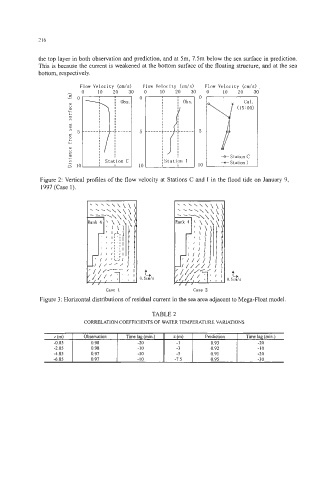
the top layer in both observation and prediction, and at 5m, 7.5m below the sea surface in prediction.
This is because the current is weakened at the bottom surface of the floating structure, and at the sea
bottom, respectively.
Flow Velocity (cm/s) Flow Velocity (cm/s) Flow Velocity (cm/s) .
0 10 20 30 0 10 20 30 0 10 20 30
= o
+Station C
*Station I
Figure 2: Vertical profiles of the flow velocity at Stations C and I in the flood tide on January 9,
1997 (Case 1).
Case 1 Case 2
Figure 3: Horizontal distributions of residual current in the sea area adjacent to Mega-Float model.
TABLE 2
CORRELATION COEFFICIENTS OF WATER TEMPERATURE VARIATIONS
z (m) I Observation I Time lag (min.) I z (m) I Prediction I Time lag (min.)
-0.85 1 0.98 I -20 I -1 I 0.93 I -20
-2.85 0.98 -10 -3 0.92 -10
-4.85 0.97 -10 -5 0.91 -20
-6.85 0.97 -10 -7.5 0.95 -3 0