
Page 242 - Practical Design Ships and Floating Structures
P. 242
217
Dissolved Oxygen (mg/l) Dissolved Oxygen (ag/l) Dissolved Oxygen (mg/l)
2 4 6 81012 2 4 6 8 1012 2 4 6 8 1012
Station A.C Station F . J
i; 15 15
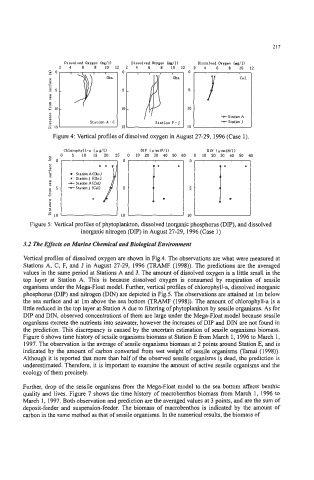
Figure 4: Vertical profiles of dissolved oxygen in August 27-29, 1996 (Case 1).
Chlorophyll-a (e g/l) DIP (smalP/l) DIN (umolN/l)
0 5 10 15 20 25 0 10 20 30 40 50 60 0 10 20 30 40 50 60
l " " 1
Station A (Obd
= Station J (Cbd
-a-StationA(Call
-StationJ (Call
Figure 5: Vertical profiles of phytoplankton, dissolved inorganic phosphorus (DIP), and dissolved
inorganic nitrogen (DIP) in August 27-29,1996 (Case 1)
3.2 The Effectv on Marine Chemical and BioIogkal Environment
Vertical profiles of dissolved oxygen are shown in Fig.4. The observations are what were measured at
Stations A, C, F, and J in August 27-29, 1996 (TRAMF (1998)). The predictions are the averaged
values in the same period at Stations A and J. The amount of dissolved oxygen is a little small in the
top layer at Station A. This is because dissolved oxygen is consumed by respiration of sessile
organisms under the Mega-Float model. Further, vertical profiles of chlorophyll-a, dissolved inorganic
phosphorus (DIP) and nitrogen (DIN) are depicted in Fig5 The observations are attained at Im below
the sea surface and at lm above the sea bottom (TRAMF (1998)). The amount of chlorophyll-a is a
little reduced in the top layer at Station A due to filtering of phytoplankton by sessile organisms. As for
DIP and DIN, observed concentrations of them are large under the Mega-Float model because sessile
organisms excrete the nutrients into seawater, however the increases of DIP and DIN are not found in
the prediction. This discrepancy is caused by the uncertain estimation of sessile organisms biomass.
Figure 6 shows time history of sessile organisms biomass at Station E from March 1, 1996 to March 1,
1997. The Observation is the average of sessile organisms biomass at 2 points around Station E, and is
indicated by the amount of carbon converted from wet weight of sessile organisms (Tamai (1998)).
Although it is reported that more than half of the observed sessile organisms is dead, the prediction is
underestimated. Therefore, it is important to examine the amount of active sessile organisms and the
ecology of them precisely.
Further, drop of the sessile organisms from the Mega-Float model to the sea bottom affects benthic
quality and lives. Figure 7 shows the time history of macrobenthos biomass fiom March 1, 1996 to
March 1, 1997. Both observation and prediction are the averaged values at 3 points, and are the sum of
deposit-feeder and suspension-feeder. The biomass of macrobenthos is indicated by the amount of
carbon in the same method as that of sessile organisms. In the numerical results, the biomass of