
Page 243 - Practical Design Ships and Floating Structures
P. 243
218
.
600
as. Station E
450 -_Gal..
.
300 e
-
150
0
3 4 5 6 7 8 9 10 11 12 1 2 3
1996 1997 (Month)
Figure 6: Time history of sessile organisms biomass from March 1, 1996 to March 1, 1997 (Case 1)
Macrobenthos (gC/mZ)
All I
Station &C,D (0s)
10 x Station G,H,K(Obs.)
-Station &C,D (Cal.)
- Station G,ttK (Cd3
3 4 5 6 7 8 9 10 11 12 1 2 3
1996 1997 (Month)
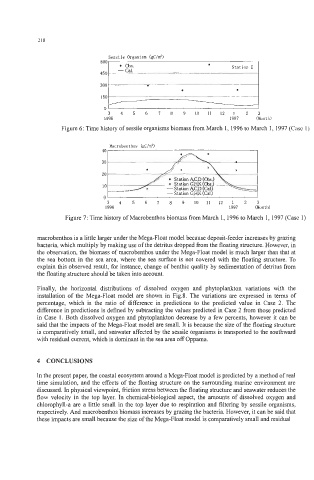
Figure 7: Time history of Macrobenthos biomass from March 1,1996 to March 1, 1997 (Case 1)
macrobenthos is a little larger under the Mega-Float model because deposit-feeder increases by grazing
bacteria, which multiply by making use of the detritus dropped from the floating structure. However, in
the observation, the biomass of macrobenthos under the Mega-Float model is much larger than that at
the sea bottom in the sea area, where the sea surface is not covered with the floating structure. To
explain this observed result, for instance, change of benthic quality by sedimentation of detritus from
the floating structure should be taken into account.
Finally, the horizontal distributions of dissolved oxygen and phytoplankton variations with the
installation of the Mega-Float model are shown in Fig.8. The variations are expressed in terms of
percentage, which is the ratio of difference in predictions to the predicted value in Case 2. The
difference in predictions is defined by subtracting the values predicted in Case 2 from those predicted
in Case 1. Both dissolved oxygen and phytoplankton decrease by a few percents, however it can be
said that the impacts of the Mega-Float model are small. It is because the size of the floating structure
is comparatively small, and seawater affected by the sessile organisms is transported to the southward
with residual current, which is dominant in the sea area off Oppama.
4 CONCLUSIONS
In the present paper, the coastal ecosystem around a Mega-Float model is predicted by a method of real
time simulation, and the effects of the floating structure on the surrounding marine environment are
discussed. In physical viewpoint, friction stress between the floating structure and seawater reduces the
flow velocity in the top layer. In chemical-biological aspect, the amounts of dissolved oxygen and
chlorophyll-a are a little small in the top layer due to respiration and filtering by sessile organisms,
respectively. And macrobenthos biomass increases by grazing the bacteria. However, it can be said that
these impacts are small because the size of the Mega-Float model is comparatively small and residual