Page 417 - Practical Design Ships and Floating Structures
P. 417
392


              3.2 Inverse Heat Conduction Analp&
              Figure 5 shows the measured distributions of plate back face temperature. From this figure, the the
              lay between the temperatures at the points is clearly observed, due to a thermal conductivity in the plate.
               Figure 5 also shows that the tempem on the back face does not always reach its maximUm at the
               center.
               The distribution of plate surface temperature and heat flux on the heating surface can be estimated by
               finite-difference inverse heat conduction analysis describd in Beck et al. (1985).
               Hereafter, TB and TS denote back  and heating surface plate temperatures.  p,  c and  K are density,
               specific heat and heat conductivity of steel.  t is the elapsed time since heating starts,  and prefix A
               means the change over the time increment.
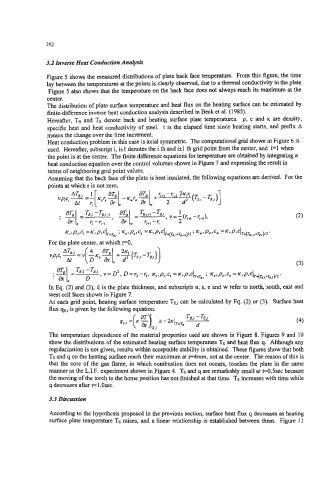
               Heat conduction problem in this case is axial symmetrk. The computational grid shown in Figure 6 is
               used.  Hereafter, subscript i, i+l denotes the i th and ikl th grid point from the center, and  i=l when
               the point is at the center.  The finite difference equations for temperature are obtained by integrating a
               heat conduction equation over the control volumes shown in Figure 7 and expressing the result in
               terms of neighboring grid point values.
               Assuming that the back face of the plate is heat insulated, the following equations are derived.  For the
               points at which r is not zero,


               For the plate center, at which r=O,


               In Eq. (2) and (3), d is the plate thickness, and subscripts n, s,  e and w refer to north, south, east and
               west cell faces shown in Figure 7.
               At each grid point, heating surface temperature Ts,i can be calculated by Eq. (2) or (3).  Surface heat
               flux qs,i is given by the following equation.


               The temperature dependence of the material properties used are shown in Figure 8. Figures 9 and  10
               show the distributions of the estimated heating surface temperature Ts and heat flux q.  Although any
               regularization is not given, results within acceptable stability is obtained.  These figures show that both
               Ts and q on the heating surface reach their maximum at dmm, not at the center.  The reason of this is
               that the core of the gas  flame, in which combustion does not occurs, touches the plate in the same
               manner as the L.I.F.  experiment shown in Figure 4.  Ts and q are remarkably small at H.5-  because
               the moving of the torch to the home position has not finished at that time.  Ts increases with time while
               q decreases after t=l .Osec.

               3.3 Discusswn
               According to the hypothesis proposed in the previous section, surface heat flux q decreases as heating
               surface plate temperature TS raises, and a linear relationship is established between them.  Figure 11

