
Page 419 - Practical Design Ships and Floating Structures
P. 419
394
References
Moshaiov A. and Latorre R.(1985) Temperature Distribution During Plate Bending by Torch Flame
Heating, Journal of Ship Research 29: 1, pp. 1-1 1.
Tsuji I. and Okumura Y.(1977) A Study on Line Heating Process for Plate Bending of Ship Steels,
Trans. The WestJapan SOC. Naval Architects 76, pp.149-160 (in Japanese).
Terasaki T., Kitamura N. and Nakai M.(1999) Predictive muation for Thermal Cycle Generated by
Line Heating Method, Trans. The WestJapan SOC. Naval Architects 99, pp.321-329 (in Japanese).
Beck J.V., Blackwell B. and St. Clair Jr., C. R.(1985) Inverse Heat Conduction, A Weley-Interscience
Publication.
TABLE 1
FLUX AND PRESSURE OF CHEMICAL SPECIES USED
IN THE L.I.F. EXPERIMENT (a) Z=12mm
flux (m’/sec) pressure (ma)
NO 2.50~10~ 98.07
02 2.83~10’ 245.17
CIC 2.67~10’ 196.13
(b) Z4Omm
.I. .. , ~ . . . .. . . .. .. . .
(c) Z=28mm
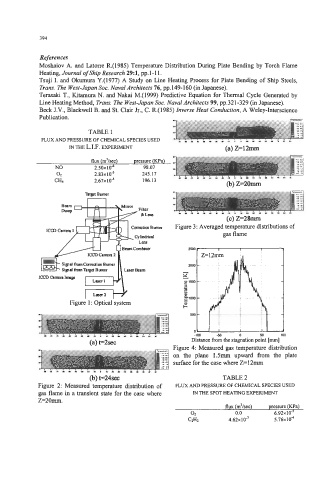
Corrrdnn Bma Figure 3: Averaged temperature distributions of
ICCD cmw 1
gas flame
I
Figure 1 : Optical system
:,I
e - rn .~ ,. I/ . .r . ,* 4W 50 50 0
u I .L ~ ,e
(a) t=2sec Distance from the stagnation point [mm]
Figure 4: Measured gas temperature distribution
\I
on the plane 1.5m upward from the plate
surface for the case where Z=12m
.*.
- = = * 1 0 1 1 * . 1 * * * , o . * m m m - z
(b) t44sec TABLE 2
Figure 2: Measured temperature distribution of FLUX AM) PRESSURE OF CHEMICAL SPECIES USED
gas flame in a transient state for the case where IN THE SPOT HEATING EXPERIMENT
z=20mm.
flux (m’/sec) pressure (KPa)
02 0.0 6.92~ IOs
CzHz 4.62~10’ 5.76~10~