
Page 420 - Practical Design Ships and Floating Structures
P. 420
395
lw0
zm
e!
3
Bm
?
G
403
m Temperature [K]
0 2 0 4 0 0 0 1 I w
Distance from the stagnation point r [mm]
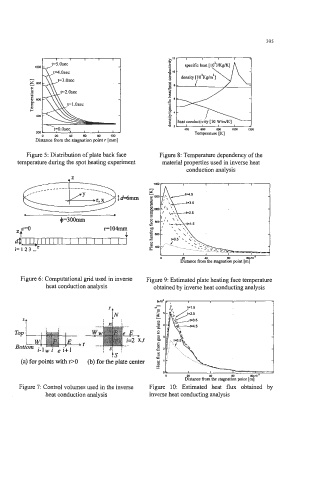
Figure 5: Distribution of plate back face Figure 8: Temperature dependency of the
temperature during the spot heating experiment material properties used in inverse heat
conduction analysis
r=104mm
Z P
0 20 49 en LlhIO'
Distance from the stagnation point [m]
Figure 6: Computational grid used in inverse Figure 9: Estimated plate heating face temperature
heat conduction analysis obtained by inverse heat conducting analysis
I I I I I
Y
ki
0 20 49 W at0
D~stsnce from the stagnation point [m]
Figure 7: Control volumes used in the inverse Figure 10: Estimated heat flux obtained by
heat conduction analysis inverse heat conducting analysis