Page 424 - Practical Design Ships and Floating Structures
P. 424
399

        4) Joining of the strips. A developed view of the hull plate with crevices is obtained  by joining the
        surface strips along the reference line in a proper sequence. These crevices are to be removed by  line
        heat forming.


        3 QUANTITATIVE ANALYSIS OF LOCAL DEFORMATION BY FLAME BENDING M
        From the study on the relation between the integral shape and the local deformation values, it is known
        that complicated as the curved surface is, flame bending can be conducted on a quantitative basis if the
        local deformation can be determined. So it is necessary to define the different factors influencing local
        deformations,  and this is one of the main  technical difficulties in  flame bending.  Among the many
        technical parameters,  transverse contractions and angular deformations are of great significance. This
        paper deals with the relation between transverse contraction &d  some main parameters.

        3.1 Establishment of mathematical model

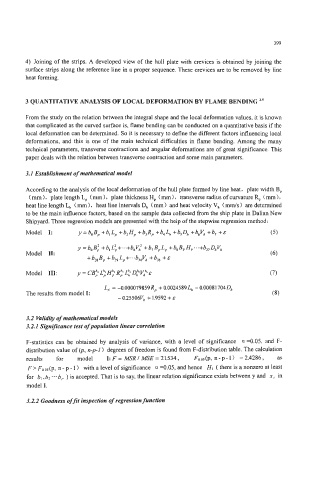
        According to the analysis of the local deformation of the hull plate formed by line heat,  plate width B,
         ( mm ) , plate length L,  ( mm ),  plate thickness H,  ( mm ),  transverse radius of curvature R,,  ( mm ),
        heat line length L,  ( nun 1,  heat line intervals D, ( mm ) and heat velocity V, ( d  s 1 are determined
        to be the main influence factors, based on the sample data collected from the ship plate in Dalian New
        Shipyard. Three regression models are presented with the help of the stepwise regression method:
        Model  I:       y = boB, +b, L, + b2H, +b,R, +b4 L, +b,D,  +b6Vh +b, +E   (5)


         Model  111:     = CB; L; H," R; L?  D,"v,".E
                               Ls = -0.000079859R,  + 0.00245891, - 0.00081 7040,
         The results from model I:
                                   - 0.25506Vh + 1.9592 + E


         3.2 Validity of mathematical models
        3.2.1 Significance test of population linear correlation

         F-statistics  can  be  obtained  by  analysis  of  variance,  with  a  level  of  significance  a =0.05.  and  F-
         distribution value of (p, n-p-1 ) degrees of freedom is found from F-distribution table. The calculation
         results   for   model   I: F = MSR I  MSE = 21534,   Foos(p, n - p - 1 )  = 2.4286,   as
         F > Foos(p, n - p - 1 )  with a level of significance  a =0.05,  and hence  HI ( there is a nonzero at least
         for  bl . bz ..*  6, ) is accepted. That is to say, the linear relation significance exists between y and  x,  in
         model I.

         3.2.2 Goodness offit inspection of regression functwn

