
Page 421 - Practical Design Ships and Floating Structures
P. 421
396
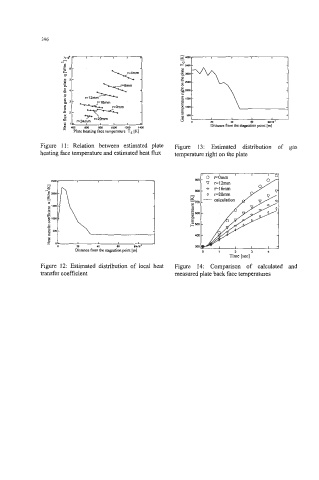
Figure 11: Relation between estimated plate Figure 13: Estimated distribution of gas
heating face temperature and estimated heat flux temperature right on the plate
0 1 2 3 4
Time [sec]
Figure 12: Estimated distribution of local heat Figure 14: Comparison of calculated and
transfer coefficient measured plate back face temperatures