
Page 529 - Practical Design Ships and Floating Structures
P. 529
504
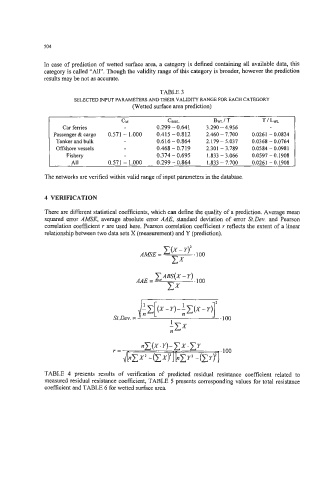
In case of prediction of wetted surface area, a category is defined containing all available data, this
category is called “All”. Though the validity range of this category is broader, however the prediction
results may be not as accurate.
TABLE 3
SELECTED INPUT PARAMETERS AND THEIR VALIDITY RANGE FOR EACH CATEGORY
(Wetted surface area prediction)
CM CBwL Bml T TIL=
Car ferries 0.299 - 0.641 3.290 - 4.956
Passenger & cargo 0.571 - 1.000 0.415 -0.812 2.460-7.700 0.0261 -0.0824
Tanker and bulk 0.616 - 0.864 2.179 - 5.037 0.0368 - 0.0764
Offshore vessels 0.468 - 0.719 2.301 - 3.789 0.0584 - 0.0981
Fishery 0.374 - 0.695 1.833 - 3.066 0.0597 - 0.1908
All 0.571 - 1 .OOO 0.299 - 0.864 1.833 - 7.700 0.0261 - 0.1908
The networks are verified within valid range of input parameters in the database.
4 VERIFICATION
There are different statistical coefficients, which can define the quality of a prediction. Average mean
squared error AME, average absolute enor ME, standard deviation of error St.Dev. and Pearson
correlation coefficient r are used here. Pearson correlation coefficient r reflects the extent of a linear
relationship between two data sets X (measurement) and Y (prediction).
C”BS(X - Y)
AAE= .loo
cx
St.Dev. = .loo
‘EX
n
TABLE 4 presents results of verification of predicted residual resistance coefficient related to
measured residual resistance coefficient, TABLE 5 presents corresponding values for total resistance
coefficient and TABLE 6 for wetted surface ara.