
Page 530 - Practical Design Ships and Floating Structures
P. 530
505
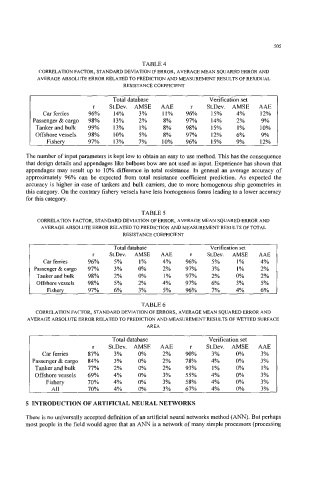
TABLE 4
CORRELATION FACTOR, STANDARD DEVIATION IF ERROR, AVERAGE MEAN SQUARED ERROR AND
AVERAGE ABSOLUTE ERROR RELATED TO PREDICTION AND MEASUREMENT RESULTS OF RESIDUAL
RESISTANCE COEFFICIENT
Total database Verification set
r St.Dev. AMSE AAE r St.Dev. AMSE AAE
Car femes 96% 14% 3% 11% 96% 15% 4% 12%
Passenger&cargo 98% 13% 2% 8% 97% 14% 2% 9%
Tankerandbulk 99% 13% 1% 8% 98% 15% 1% 10%
Offshorevessels 98% 10% 5% 8% 97% 12% 6% 9%
Fishery 97% 13% 7% 10% 96% 15% 9% 12%
The number of input parameters is kept low to obtain an easy to use method. This has the consequence
that design details and appendages like bulbous bow are not used as input. Experience has shown that
appendages may result up to 10% difference in total resistance. In general an average accuracy of
approximately 96% can be expected from total resistance coefficient prediction. As expected the
accuracy is higher in case of tankers and bulk carriers, due to more homogenous ship geometries in
this category. On the contrary fishery vessels have less homogenous forms leading to a lower accuracy
for this category.
TABLE 5
CORRELATION FACTOR, STANDARD DEVIATION OF ERROR, AVERAGE MEAN SQUARED ERROR AND
AVERAGE ABSOLUTE ERROR RELATED TO PREDICTION AND MEASUREMENT RESULTS OF TOTAL
RESISTANCE COEFFICIENT
Total database Verification set
r St.Dev. AMSE AAE r St.Dev. AMSE AAE
Car femes 96% 5% 1% 4% 96% 5% 1% 4%
Passenger8ccargo 97% 3% 0% 2% 97% 3% 1% 2%
Tankerand bulk 98% 2% 0% 1% 97% 2% 0% 2%
Offshorevessels 98% 5% 2% 4% 97% 6% 3% 5%
Fishery 97% 6% 3% 5% 96% 7% 4% 6%
TABLE 6
CORRELATION FACTOR, STANDARD DEVIATION OF ERRORS, AVERAGE MEAN SQUARED ERROR AND
AVERAGE ABSOLUTE ERROR RELATED TO PREDICTION AND MEASUREMENT RESULTS OF W"ED SURFACE
AREA
Total database Verification set
r St.Dev. AMSE AAE r St.Dev. AMSE AAE
Car femes 87% 3% 0% 2% 90% 3% 0% 3%
Passenger&cargo 84% 3% 0% 2% 78% 4% 0% 3%
Tankerandbulk 77% 2% 0% 2% 93% 1% 0% 1 Yo
Offshorevessels 69% 4% 0% 3% 55% 4% 0% 3%
Fishery 70% 4% 0% 3% 58% 4% 0% 3%
All 70% 4% 0% 3% 67% 4% 0% 3%
5 INTRODUCTION OF ARTIFICIAL NEURAL NETWORKS
There is no universally accepted definition of an artificial neural networks method (ANN). But perhaps
most people in the field would agree that an ANN is a network of many simple processors (processing