
Page 139 - Pressure Vessel Design Manual
P. 139
Design of Vessel Supports 119
Table 3-9 qs= 70mph =12.6psf C.= 0-15=1.06 100=1.61
Design Wind Pressures for Zones 80 mph = 16.4 psf 20=1.13 120=1.67
90 mph = 20.8 psf 25 = 1.19 160 = 1.79
Values of P - PSF 100 mph = 25.6 psf 30= 1.23 200= 1.87
110mph =31 .O psf 40 = 1.31 300 = 2.05
Height 70 80 90 100 110 120 130 120mph=36.9psf 60 = 1.43
Zone mph mph mph mph mph mph mph 130mph=43.3psf 80 = 1.53
0-15 12.29 15.99 20.28 24.97 30.23 35.98 42.23
20 13.10 17.05 21.62 26.61 32.23 38.36 45.01
25 13.79 17.95 22.77 28.03 33.94 40.40 47.40 Exposure D represents the most severe exposure in areas
30 14.26 18.56 23.54 28.97 35.08 41.75 49.00 with basic wind speeds of 80mph or greater, and terrain,
40 15.19 19.77 25.07 30.85 37.36 44.47 52.19 which is flat, unobstructed and faces large bodies of water
60 16.58 21.58 27.36 33.68 40.78 48.55 56.97 over one mile or more in width relative to any quadrant of
80 17.74 23.08 29.28 36.03 43.64 51.94 60.95 the building site. Exposure D extends inland from the shore-
100 18.66 24.29 30.81 37.68 45.92 54.66 64.14 line ‘/4 mile or 10 times the building height, whichever is
120 19.35 25.20 31.96 39.33 47.63 56.69 66.53 greater.
160 20.75 27.01 34.25 42.15 51.05 60.77 71.31
200 21.68 28.21 35.78 44.04 53.33 63.48 74.49 Design wind pressure. At any elevation, P, is computed by
300 23.76 30.93 39.23 48.28 58.47 69.59 81.66 the following equation:
Note: Table is based on exposure category “C” and the following values: P = c,c,qJ
P = CeC,,qsl
where:
Cq=0.8 1=1.15
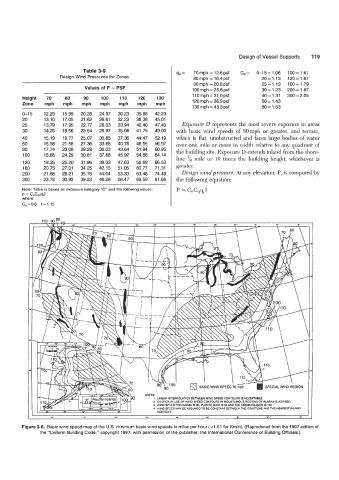
Figure 3-6. Basic wind speed map of the U.S. minimum basic wind speeds in miles per hour (x 1.61 for Km/h). (Reproduced from the 1997 edition of
the “Uniform Building Code,” copyright 1997, with permission of the publisher, the International Conference of Building Officials.)