
Page 227 - Principles of Applied Reservoir Simulation 2E
P. 227
212 Principles of Applied Reservoir Simulation
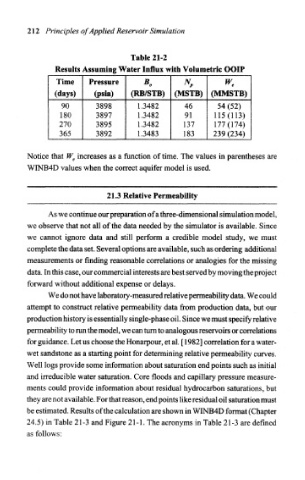
Table 21-2
Results Assuming Water Influx with Volumetric OOIP
Time Pressure B. w.
(days) (psia) (RB/STB) (MSTB) (MMSTB)
^
90 3898 1.3482 46 54 (52)
180 3897 1.3482 91 115(113)
270 3895 1.3482 137 177(174)
365 3892 1.3483 183 239 (234)
Notice that W e increases as a function of time. The values in parentheses are
WINB4D values when the correct aquifer model is used.
21.3 Relative Permeability
As we continue our preparation of a three-dimensional simulation model,
we observe that not all of the data needed by the simulator is available. Since
we cannot ignore data and still perform a credible model study, we must
complete the data set. Several options are available, such as ordering additional
measurements or finding reasonable correlations or analogies for the missing
data. In this case, our commercial interests are best served by moving the project
forward without additional expense or delays.
We do not have laboratory-measured relative permeability data. We could
attempt to construct relative permeability data from production data, but our
production history is essentially single-phase oil. Since we must specify relative
permeability to run the model, we can turn to analogous reservoirs or correlations
for guidance. Let us choose the Honarpour, et al. [ 1982] correlation for a water-
wet sandstone as a starting point for determining relative permeability curves.
Well logs provide some information about saturation end points such as initial
and irreducible water saturation. Core floods and capillary pressure measure-
ments could provide information about residual hydrocarbon saturations, but
they are not available. For that reason, end points like residual oil saturation must
be estimated. Results of the calculation are shown in WINB4D format (Chapter
24.5) in Table 21-3 and Figure 21-1. The acronyms in Table 21-3 are defined
as follows: