
Page 229 - Principles of Applied Reservoir Simulation 2E
P. 229
214 Principles of Applied Reservoir Simulation
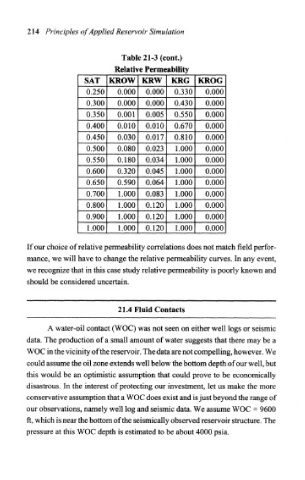
Table 21-3 (cont.)
Relative Permeability
SAT KROW KRW KRG KROG
0.250 0.000 0.000 0.330 0.000
0.300 0.000 0.000 0.430 0.000
0.350 0.001 0.005 0.550 0.000
0.400 0.010 0.010 0.670 0.000
0.450 0.030 0.017 0.810 0.000
0.500 0.080 0.023 1.000 0.000
0.550 0.180 0.034 1.000 0.000
0.600 0.320 0.045 1.000 0.000
0.650 0.590 0.064 1.000 0.000
0.700 1.000 0.083 1.000 0.000
0.800 1.000 0.120 1.000 0.000
0.900 1.000 0.120 1.000 0.000
1.000 1.000 0.120 1.000 0.000
If our choice of relative permeability correlations does not match field perfor-
mance, we will have to change the relative permeability curves. In any event,
we recognize that in this case study relative permeability is poorly known and
should be considered uncertain.
21.4 Fluid Contacts
A water-oil contact (WOC) was not seen on either well logs or seismic
data. The production of a small amount of water suggests that there may be a
WOC in the vicinity of the reservoir. The data are not compelling, however. We
could assume the oil zone extends well below the bottom depth of our well, but
this would be an optimistic assumption that could prove to be economically
disastrous. In the interest of protecting our investment, let us make the more
conservative assumption that a WOC does exist and is just beyond the range of
our observations, namely well log and seismic data. We assume WOC ~ 9600
ft, which is near the bottom of the seismically observed reservoir structure. The
pressure at this WOC depth is estimated to be about 4000 psia.