
Page 132 - Probability Demystified
P. 132
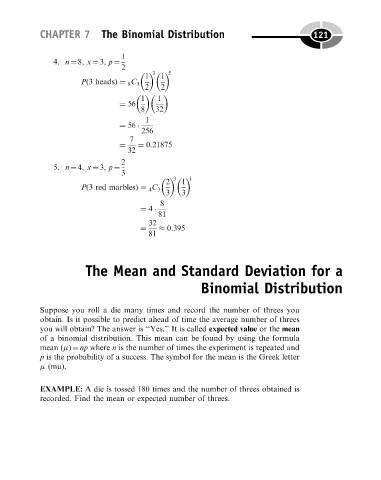
CHAPTER 7 The Binomial Distribution                                         121

                                            1
                         4. n ¼ 8, x ¼ 3, p ¼
                                            2
                                                         5
                                                    3
                                                  1    1
                                Pð3 headsÞ¼ C   3
                                             8
                                                  2    2

                                                 1    1
                                           ¼ 56
                                                 8   32
                                                  1
                                           ¼ 56
                                                 256
                                              7
                                           ¼    ¼ 0:21875
                                             32
                                            2
                         5. n ¼ 4, x ¼ 3, p ¼
                                            3
                                                        2  3  1  1
                                Pð3 red marblesÞ¼ C   3
                                                   4
                                                        3   3
                                                      8
                                                 ¼ 4
                                                      81
                                                   32
                                                 ¼      0:395
                                                   81


                                  The Mean and Standard Deviation for a

                                                                  Binomial Distribution


                     Suppose you roll a die many times and record the number of threes you
                     obtain. Is it possible to predict ahead of time the average number of threes
                     you will obtain? The answer is ‘‘Yes.’’ It is called expected value or the mean
                     of a binomial distribution. This mean can be found by using the formula
                     mean ( ) ¼ np where n is the number of times the experiment is repeated and
                     p is the probability of a success. The symbol for the mean is the Greek letter
                       (mu).


                     EXAMPLE: A die is tossed 180 times and the number of threes obtained is
                     recorded. Find the mean or expected number of threes.