
Page 424 - Probability and Statistical Inference
P. 424
8. Tests of Hypotheses 401
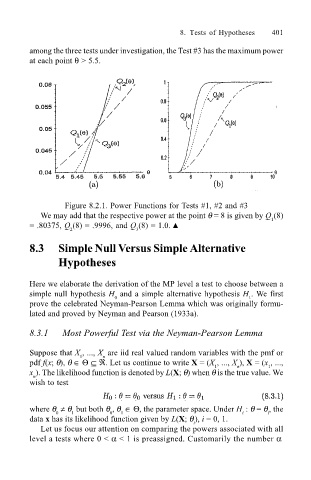
among the three tests under investigation, the Test #3 has the maximum power
at each point θ > 5.5.
Figure 8.2.1. Power Functions for Tests #1, #2 and #3
We may add that the respective power at the point θ = 8 is given by Q (8)
1
= .80375, Q (8) = .9996, and Q (8) = 1.0. !
2 3
8.3 Simple Null Versus Simple Alternative
Hypotheses
Here we elaborate the derivation of the MP level a test to choose between a
simple null hypothesis H and a simple alternative hypothesis H . We first
0
1
prove the celebrated Neyman-Pearson Lemma which was originally formu-
lated and proved by Neyman and Pearson (1933a).
8.3.1 Most Powerful Test via the Neyman-Pearson Lemma
Suppose that X , ..., X are iid real valued random variables with the pmf or
n
1
pdf f(x; θ), θ ∈ Θ ⊆ ℜ. Let us continue to write X = (X , ..., X ), X = (x , ...,
1
n
1
x ). The likelihood function is denoted by L(X; θ) when θ is the true value. We
n
wish to test
where θ ≠ θ but both θ , θ ∈ Θ, the parameter space. Under H : θ = θ , the
i
i
0
1
1
0
data x has its likelihood function given by L(X; θ ), i = 0, 1.
i
Let us focus our attention on comparing the powers associated with all
level a tests where 0 < α < 1 is preassigned. Customarily the number α