
Page 72 - Probability and Statistical Inference
P. 72
1. Notions of Probability 49
random variable.
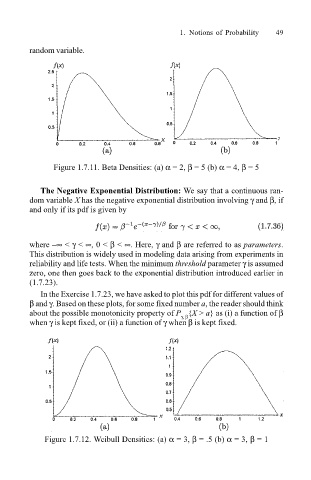
Figure 1.7.11. Beta Densities: (a) α = 2, β = 5 (b) α = 4, β = 5
The Negative Exponential Distribution: We say that a continuous ran-
dom variable X has the negative exponential distribution involving γ and β, if
and only if its pdf is given by
where ∞ < γ < ∞, 0 < β < ∞. Here, γ and β are referred to as parameters.
This distribution is widely used in modeling data arising from experiments in
reliability and life tests. When the minimum threshold parameter γ is assumed
zero, one then goes back to the exponential distribution introduced earlier in
(1.7.23).
In the Exercise 1.7.23, we have asked to plot this pdf for different values of
β and γ. Based on these plots, for some fixed number a, the reader should think
about the possible monotonicity property of P {X > a} as (i) a function of β
γ, β
when γ is kept fixed, or (ii) a function of γ when β is kept fixed.
Figure 1.7.12. Weibull Densities: (a) α = 3, β = .5 (b) α = 3, β = 1