Page 126 - Process Equipment and Plant Design Principles and Practices by Subhabrata Ray Gargi Das
P. 126

5.3 Multi-stream problem    123


                  and

                                        CP h                   CP h   CP h
                                               2                                3
                                     1          ðTS h   TS c Þ 1    þ     ðDT min Þ
                                        CP c                   CP c   CP c
                                             ln 4                               5           (5.10)
                              A ex ¼
                                     CP h U ex               ðDT min Þ
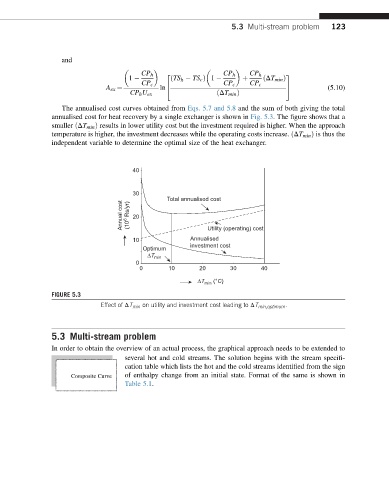
                  The annualised cost curves obtained from Eqs. 5.7 and 5.8 and the sum of both giving the total
               annualised cost for heat recovery by a single exchanger is shown in Fig. 5.3. The figure shows that a
               smaller ðDT min Þ results in lower utility cost but the investment required is higher. When the approach
               temperature is higher, the investment decreases while the operating costs increase. ðDT min Þ is thus the
               independent variable to determine the optimal size of the heat exchanger.


                                      40


                                      30
                                               Total annualised cost
                                   Annual cost  (10 6  Rs/yr)  20


                                                           Utility (operating) cost
                                      10              Annualised
                                                      investment cost
                                         Optimum
                                          ΔT min
                                       0
                                        0       10      20       30      40
                                                        ΔT min  (°C)

               FIGURE 5.3
                             Effect of DT min on utility and investment cost leading to DT min;optimum .


               5.3 Multi-stream problem
               In order to obtain the overview of an actual process, the graphical approach needs to be extended to
                                    several hot and cold streams. The solution begins with the stream specifi-
                                    cation table which lists the hot and the cold streams identified from the sign
                     Composite Curve  of enthalpy change from an initial state. Format of the same is shown in
                                    Table 5.1.
   121   122   123   124   125   126   127   128   129   130   131