
Page 216 - Process Equipment and Plant Design Principles and Practices by Subhabrata Ray Gargi Das
P. 216
214 Chapter 7 Industrial cooling systems
3
controlled by a combination of (a) bleeding off a certain portion (B m /hr) of the recirculation water
with make up of the same quantity of water having low solid concentration, and (b) adding antiscaling
additives. The blowdown stream (B) leaves either the sump or the pump delivery header. The figure
also shows the droplets of water entrained in the exiting air. This is called drift loss (D). There is also
some water loss (L) within the process due to leakages, draining, etc. The possible sources for leakages
(uncontrolled water loss from a system) are from pump seals, valves, overflow, exchanger draining,
splash out, etc. Drifts and leaks are nonblowdown water losses. One may note that the loss streams take
out dissolved solids and suspended solids to some extent.
The makeup water stream (M) joins the sump to
compensate for the water losses from the system and to
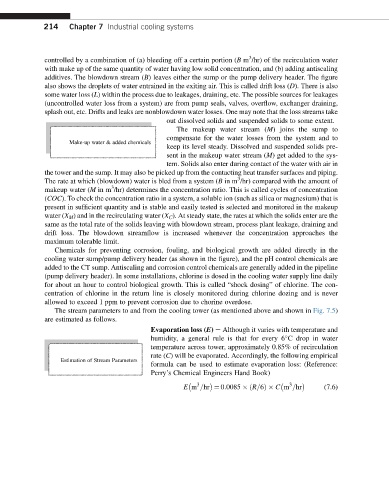
Make-up water & added chemicals
keep its level steady. Dissolved and suspended solids pre-
sent in the makeup water stream (M) get added to the sys-
tem. Solids also enter during contact of the water with air in
the tower and the sump. It may also be picked up from the contacting heat transfer surfaces and piping.
3
The rate at which (blowdown) water is bled from a system (B in m /hr) compared with the amount of
3
makeup water (M in m /hr) determines the concentration ratio. This is called cycles of concentration
(COC). To check the concentration ratio in a system, a soluble ion (such as silica or magnesium) that is
present in sufficient quantity and is stable and easily tested is selected and monitored in the makeup
water (X M ) and in the recirculating water (X C ). At steady state, the rates at which the solids enter are the
same as the total rate of the solids leaving with blowdown stream, process plant leakage, draining and
drift loss. The blowdown streamflow is increased whenever the concentration approaches the
maximum tolerable limit.
Chemicals for preventing corrosion, fouling, and biological growth are added directly in the
cooling water sump/pump delivery header (as shown in the figure), and the pH control chemicals are
added to the CT sump. Antiscaling and corrosion control chemicals are generally added in the pipeline
(pump delivery header). In some installations, chlorine is dosed in the cooling water supply line daily
for about an hour to control biological growth. This is called “shock dosing” of chlorine. The con-
centration of chlorine in the return line is closely monitored during chlorine dozing and is never
allowed to exceed 1 ppm to prevent corrosion due to chorine overdose.
The stream parameters to and from the cooling tower (as mentioned above and shown in Fig. 7.5)
are estimated as follows.
Evaporation loss (E) e Although it varies with temperature and
humidity, a general rule is that for every 6 C drop in water
temperature across tower, approximately 0.85% of recirculation
rate (C) will be evaporated. Accordingly, the following empirical
Estimation of Stream Parameters
formula can be used to estimate evaporation loss: (Reference:
Perry’s Chemical Engineers Hand Book)
3 3
E m =hr ¼ 0:0085 ðR=6Þ C m =hr (7.6)