
Page 221 - Process Equipment and Plant Design Principles and Practices by Subhabrata Ray Gargi Das
P. 221
7.2 Cooling tower 219
Cooling Technology Insitute of USA has standardized the procedure for evaluating the integral
using the Chebyshev method of integration. The integral value can also be found from a nomogram
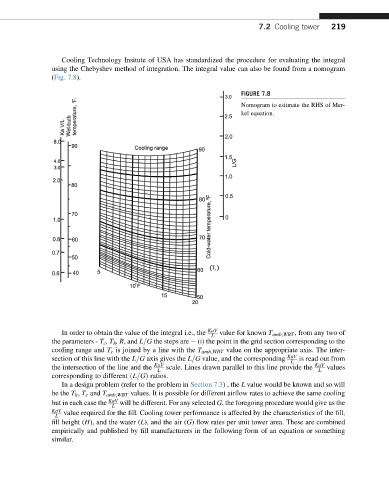
(Fig. 7.8).
FIGURE 7.8
Nomogram to estimate the RHS of Mer-
kel equation.
In order to obtain the value of the integral i.e., the KaV value for known T amb;WBT , from any two of
L
the parameters - T c ,T h ,R, and L=G the steps are e (i) the point in the grid section corresponding to the
cooling range and T c is joined by a line with the T amb;WBT value on the appropriate axis. The inter-
section of this line with the L=G axis gives the L=G value, and the corresponding KaV is read out from
L
the intersection of the line and the KaV scale. Lines drawn parallel to this line provide the KaV values
L L
corresponding to different ðL=GÞ ratios.
In a design problem (refer to the problem in Section 7.3) , the L value would be known and so will
be the T h , T c and T amb;WBT values. It is possible for different airflow rates to achieve the same cooling
but in each case the KaV will be different. For any selected G, the foregoing procedure would give us the
L
KaV
L value required for the fill. Cooling tower performance is affected by the characteristics of the fill,
fill height (H), and the water (L), and the air (G) flow rates per unit tower area. These are combined
empirically and published by fill manufacturers in the following form of an equation or something
similar.