
Page 222 - Process Equipment and Plant Design Principles and Practices by Subhabrata Ray Gargi Das
P. 222
220 Chapter 7 Industrial cooling systems
KaV n
¼ p þ q H ðL=GÞ (7.17)
L
Where p, q and n are constants for a specific fill.
Since the equation is empirical, one needs to be careful about the units of the terms in Eq. 7.17.
Table 7.2 shows the typical design range for different fill types that may be used as design
guidelines. Characteristic curve for a typical industrial fill based on data of design Illustration in
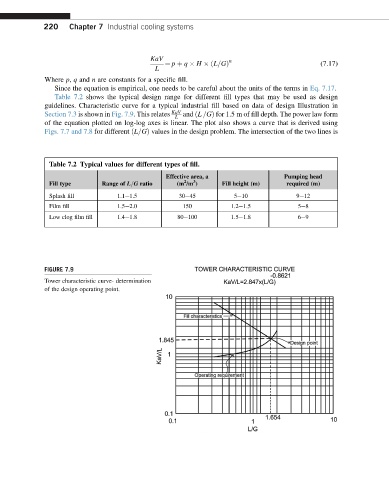
Section 7.3 is shown in Fig. 7.9. This relates KaV and ðL =GÞ for 1.5 m of fill depth. The power law form
L
of the equation plotted on log-log axes is linear. The plot also shows a curve that is derived using
Figs. 7.7 and 7.8 for different ðL=GÞ values in the design problem. The intersection of the two lines is
Table 7.2 Typical values for different types of fill.
Effective area, a Pumping head
3
2
Fill type Range of L=G ratio (m /m ) Fill height (m) required (m)
Splash fill 1.1e1.5 30e45 5e10 9e12
Film fill 1.5e2.0 150 1.2e1.5 5e8
Low clog film fill 1.4e1.8 80e100 1.5e1.8 6e9
FIGURE 7.9
Tower characteristic curve- determination
of the design operating point.