
Page 220 - Process Equipment and Plant Design Principles and Practices by Subhabrata Ray Gargi Das
P. 220
218 Chapter 7 Industrial cooling systems
-10 0 10 20 30 40 50 60 0.03
Humidity Ratio (kg of moisture pure kg of dry air) 0.02 0.02
0.03
0.01
0.01
0.00
-10 0 10 20 30 40 50 60 0.00
Dry Bulb Temperature ºC
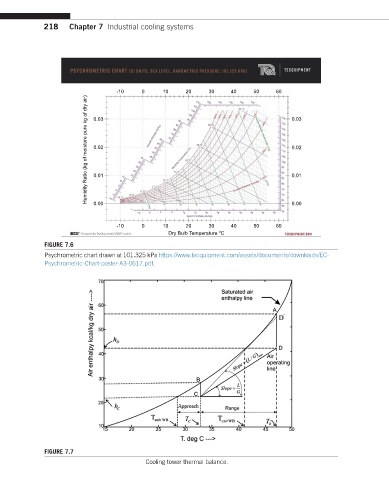
FIGURE 7.6
Psychrometric chart drawn at 101.325 kPa https://www.tecquipment.com/assets/documents/downloads/EC-
Psychrometric-Chart-poster-A3-0617.pdf.
FIGURE 7.7
Cooling tower thermal balance.