
Page 224 - Process Equipment and Plant Design Principles and Practices by Subhabrata Ray Gargi Das
P. 224
222 Chapter 7 Industrial cooling systems
Summary of available data
3
C ¼ 6000 m =hr; T h ¼ 45 C; T c ¼ 33 C; T amb;WBT ¼ 29 C;
2
Plant pressure drop in circulating water header ¼ 2 kg/cm
Tower selection
2
2
3
Water load (L) of CT usually lies between six and seven USG per ft (14.7e17.1 m /m hr)
3
2
Based on L ¼ 15 m /m hr, Tower area ¼ C/L ¼ 6000/15 ¼ 400 m 2
CT cells are usually square with up to 20 m arms (Refer to Section 7.2.2). In this case, four cells of
dimension 10 10 m are chosen to provide the tower area.
This is a moderate size tower and hence, we opt for induced draft design (Refer to Section 7.2.1).
The cells are placed side by side, with air entry from opposite sides.
It is also assumed that the circulating water is fairly clean, without much debris getting entrained in
the flow.
Fill details
The fill chosen is “Film Fill” due to its higher contact efficiency compared to “Splash Fill” and “Low
Clogging Film Fill.” Typically film fill depth varies from 1.2 to 1.5 m (see Table 7.2). Among several
types of film fills we choose C19 Film Fill with 1.5 m depth. Characteristics of C19 fill with depth
2
1.5 m under 4 to 7 US GPM/ft water load is given by the equation provided by the manufacturer as
KaV 0:8621
¼ 2:847 ðL=GÞ
L
Determination of operating L=G for the fill chosen
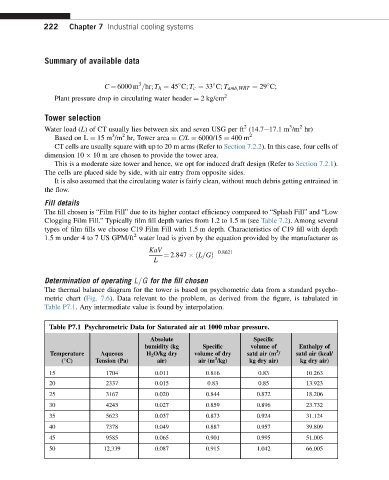
The thermal balance diagram for the tower is based on psychometric data from a standard psycho-
metric chart (Fig. 7.6). Data relevant to the problem, as derived from the figure, is tabulated in
Table P7.1. Any intermediate value is found by interpolation.
Table P7.1 Psychrometric Data for Saturated air at 1000 mbar pressure.
Absolute Specific
humidity (kg Specific volume of Enthalpy of
3
Temperature Aqueous H 2 O/kg dry volume of dry satd air (m / satd air (kcal/
3
( C) Tension (Pa) air) air (m /kg) kg dry air) kg dry air)
15 1704 0.011 0.816 0.83 10.263
20 2337 0.015 0.83 0.85 13.923
25 3167 0.020 0.844 0.872 18.206
30 4243 0.027 0.859 0.896 23.732
35 5623 0.037 0.873 0.924 31.124
40 7378 0.049 0.887 0.957 39.809
45 9585 0.065 0.901 0.995 51.005
50 12,339 0.087 0.915 1.042 66.005