
Page 240 - Process Equipment and Plant Design Principles and Practices by Subhabrata Ray Gargi Das
P. 240
240 Chapter 9 Phase equilibria
The same symbols (x, y, X, Y) are also employed at times to represent concentrations in terms of
mass (weight fraction) instead of moles. Other units of concentration, such as normality, molarity,
molality, or even a property value directly related to the concentration, e.g., absorbance or conductivity
as may be appropriate, can also be used. The partial pressure of the ith component (symbol: p i ) is also
used to represent the concentration in the vapor phase. The symbol c i is used to represent concentration
of species i in the liquid. It is expressed as mg/gm or ppmw (in liquid phase) or ppmv (in liquid phase)
or something similar. The symbol c i can also be used to represent the concentration in the immiscible
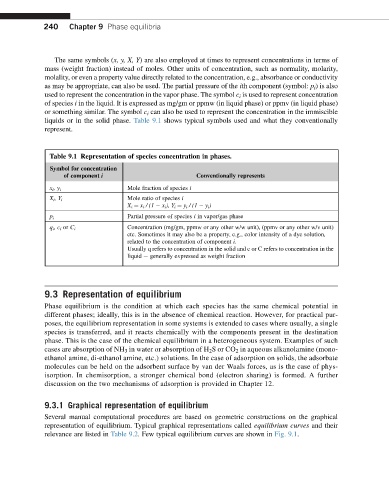
liquids or in the solid phase. Table 9.1 shows typical symbols used and what they conventionally
represent.
Table 9.1 Representation of species concentration in phases.
Symbol for concentration
of component i Conventionally represents
Mole fraction of species i
x i ,y i
Mole ratio of species i
X i ,Y i
X i ¼ x i /(1 x i ), Y i ¼ y i /(1 y i )
Partial pressure of species i in vapor/gas phase
p i
Concentration (mg/gm, ppmw or any other w/w unit), (ppmv or any other w/v unit)
q i ,c i or C i
etc. Sometimes it may also be a property, e.g., color intensity of a dye solution,
related to the concentration of component i.
Usually q refers to concentration in the solid and c or C refers to concentration in the
liquid e generally expressed as weight fraction
9.3 Representation of equilibrium
Phase equilibrium is the condition at which each species has the same chemical potential in
different phases; ideally, this is in the absence of chemical reaction. However, for practical pur-
poses, the equilibrium representation in some systems is extended to cases where usually, a single
species is transferred, and it reacts chemically with the components present in the destination
phase. This is the case of the chemical equilibrium in a heterogeneous system. Examples of such
cases are absorption of NH 3 in water or absorption of H 2 SorCO 2 in aqueous alkanolamine (mono-
ethanol amine, di-ethanol amine, etc.) solutions. In the case of adsorption on solids, the adsorbate
molecules can be held on the adsorbent surface by van der Waals forces, as is the case of phys-
isorption. In chemisorption, a stronger chemical bond (electron sharing) is formed. A further
discussion on the two mechanisms of adsorption is provided in Chapter 12.
9.3.1 Graphical representation of equilibrium
Several manual computational procedures are based on geometric constructions on the graphical
representation of equilibrium. Typical graphical representations called equilibrium curves and their
relevance are listed in Table 9.2. Few typical equilibrium curves are shown in Fig. 9.1.